| - Aluminum, FIL, DCP - |
| Lab: NWQL, PCode: 01106, MCode: DCP02 |
| Login Dates: 10/14/86 through 06/04/96 |
| Open Data Set |
| Boxplot Description |
| - Aluminum, FIL, DCP - |
| Lab: NWQL, PCode: 01106, MCode: DCP02 |
| Login Dates: 10/14/86 through 06/04/96 |
| Open Data Set |
| Boxplot Description |

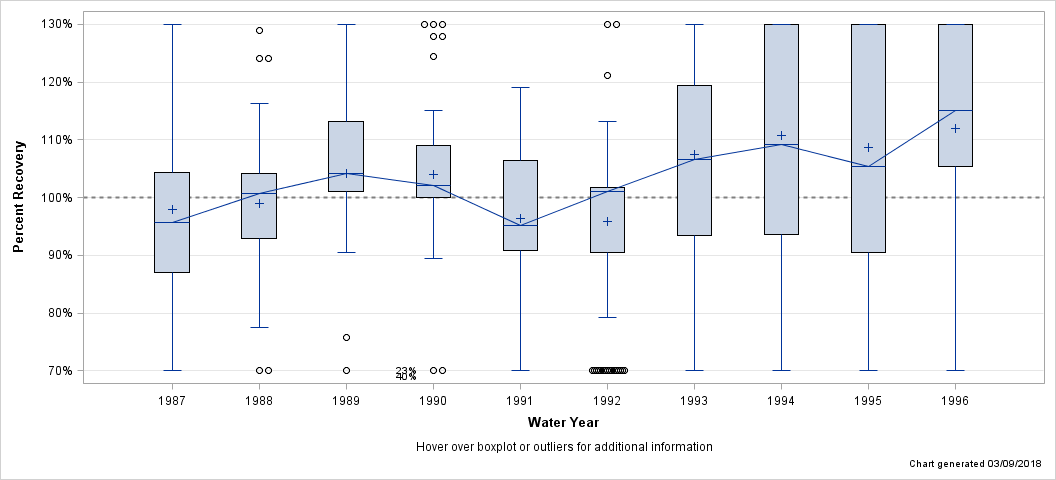
| Percent Recovery Statistics for Aluminum, FIL, DCP |
| Analyte | Parm-meth Code | Water Year | # of Samples |
25th Pctl | 50th Pctl (Median) |
75th Pctl |
|---|---|---|---|---|---|---|
| Aluminum, FIL, DCP | 01106DCP02 | 1987 | 113 | 87.0% | 95.7% | 104.3% |
| 1988 | 89 | 93.0% | 100.8% | 104.2% | ||
| 1989 | 103 | 101.0% | 104.2% | 113.1% | ||
| 1990 | 119 | 100.0% | 102.0% | 109.1% | ||
| 1991 | 72 | 90.9% | 95.2% | 106.5% | ||
| 1992 | 94 | 90.5% | 101.0% | 101.8% | ||
| 1993 | 108 | 93.5% | 106.7% | 119.4% | ||
| 1994 | 97 | 93.6% | 109.2% | 200.0% | ||
| 1995 | 76 | 90.5% | 105.4% | 200.0% | ||
| 1996 | 43 | 105.4% | 115.2% | 142.1% |
| Hover over boxplot or outliers for additional information |
| Chart generated 03/09/2018 |
| - Aluminum, FIL, DCP, LL - |
| Lab: NWQL, PCode: 01106, MCode: DCP01 |
| Login Dates: 10/08/92 through 02/21/95 |
| Open Data Set |
| Boxplot Description |
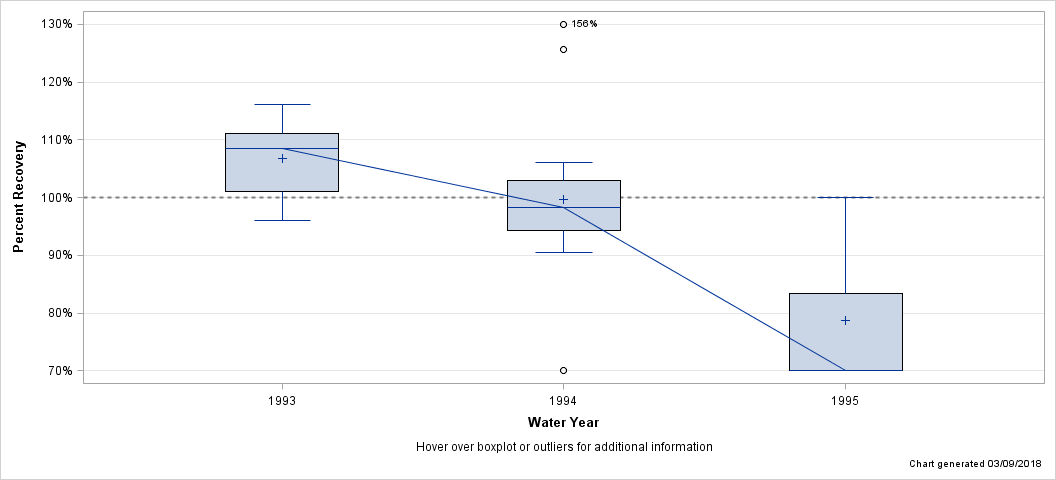
| Percent Recovery Statistics for Aluminum, FIL, DCP, LL |
| Analyte | Parm-meth Code | Water Year | # of Samples |
25th Pctl | 50th Pctl (Median) |
75th Pctl |
|---|---|---|---|---|---|---|
| Aluminum, FIL, DCP, LL | 01106DCP01 | 1993 | 8 | 101.0% | 108.6% | 111.1% |
| 1994 | 23 | 94.2% | 98.3% | 103.0% | ||
| 1995 | 5 | 66.7% | 66.7% | 83.3% |
| Hover over boxplot or outliers for additional information |
| Chart generated 03/09/2018 |
| - Aluminum, FIL, ICP-MS - |
| Lab: NWQL, PCode: 01106, MCode: PLM43 |
| Login Dates: 02/07/94 through 09/27/01 |
| Open Data Set |
| Boxplot Description |
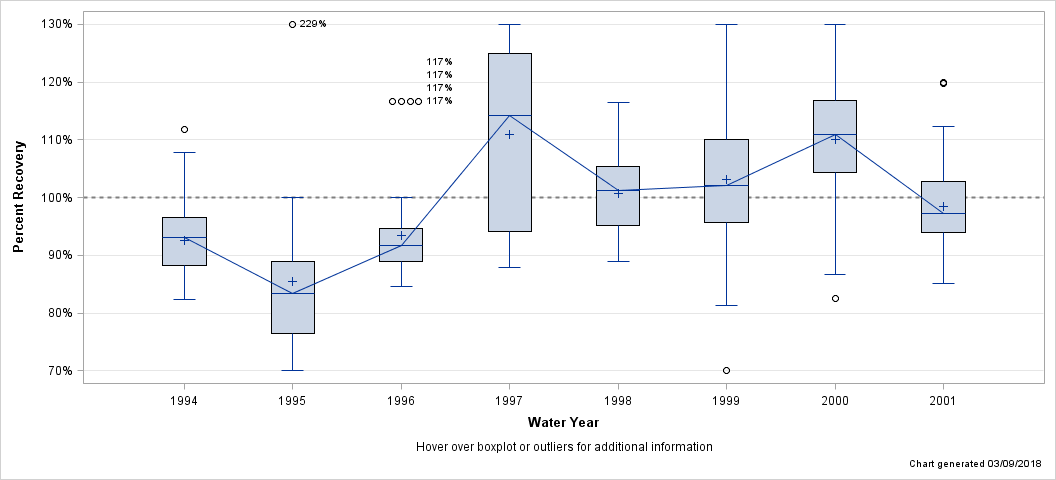
| Percent Recovery Statistics for Aluminum, FIL, ICP-MS |
| Analyte | Parm-meth Code | Water Year | # of Samples |
25th Pctl | 50th Pctl (Median) |
75th Pctl |
|---|---|---|---|---|---|---|
| Aluminum, FIL, ICP-MS | 01106PLM43 | 1994 | 32 | 88.2% | 93.0% | 96.5% |
| 1995 | 51 | 76.5% | 83.3% | 88.9% | ||
| 1996 | 46 | 88.9% | 91.8% | 94.6% | ||
| 1997 | 48 | 94.2% | 114.3% | 125.0% | ||
| 1998 | 96 | 95.1% | 101.3% | 105.3% | ||
| 1999 | 96 | 95.7% | 102.1% | 110.1% | ||
| 2000 | 72 | 104.4% | 110.9% | 116.8% | ||
| 2001 | 71 | 93.9% | 97.3% | 102.9% |
| Hover over boxplot or outliers for additional information |
| Chart generated 03/09/2018 |
| - Aluminum, FIL, ICP-OES - |
| Lab: NWQL, PCode: 01106, MCode: PLA13 |
| Login Dates: 06/07/96 through 09/27/01 |
| Open Data Set |
| Boxplot Description |
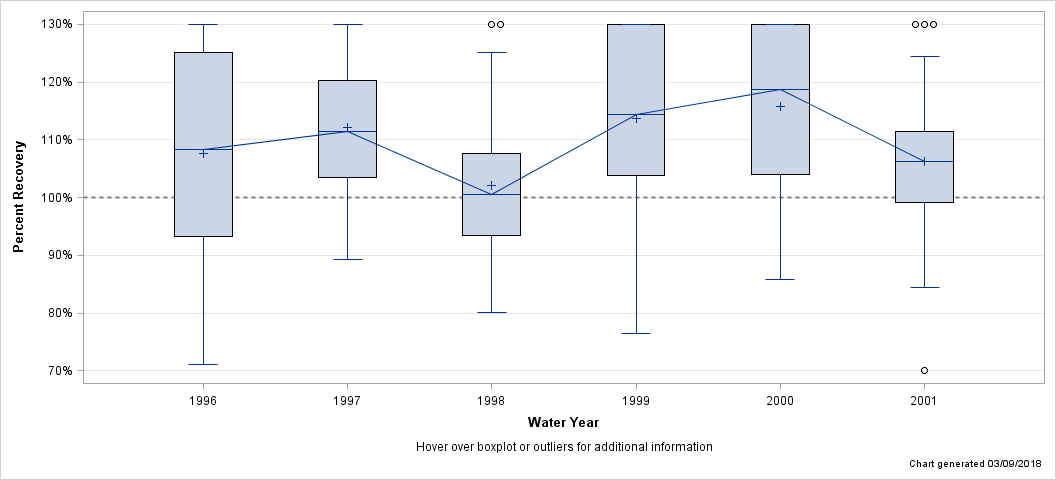
| Percent Recovery Statistics for Aluminum, FIL, ICP-OES |
| Analyte | Parm-meth Code | Water Year | # of Samples |
25th Pctl | 50th Pctl (Median) |
75th Pctl |
|---|---|---|---|---|---|---|
| Aluminum, FIL, ICP-OES | 01106PLA13 | 1996 | 21 | 93.2% | 108.3% | 125.1% |
| 1997 | 71 | 103.4% | 111.5% | 120.4% | ||
| 1998 | 31 | 93.5% | 100.5% | 107.7% | ||
| 1999 | 67 | 103.8% | 114.4% | 133.1% | ||
| 2000 | 31 | 104.0% | 118.6% | 141.9% | ||
| 2001 | 59 | 99.2% | 106.3% | 111.5% |
| Hover over boxplot or outliers for additional information |
| Chart generated 03/09/2018 |
| - Aluminum, UNF, DCP - |
| Lab: NWQL, PCode: 01105, MCode: DCP05 |
| Login Dates: 10/14/86 through 02/16/99 |
| Open Data Set |
| Boxplot Description |
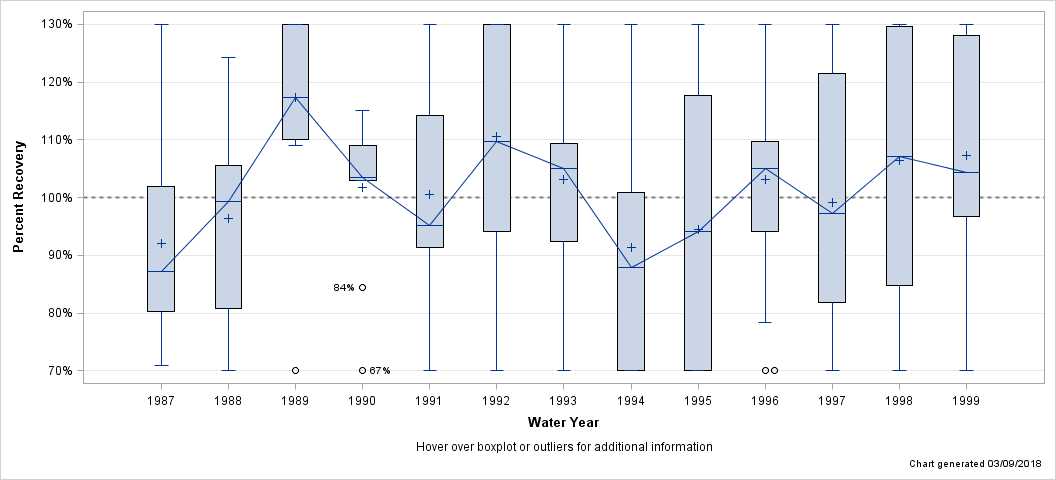
| Percent Recovery Statistics for Aluminum, UNF, DCP |
| Analyte | Parm-meth Code | Water Year | # of Samples |
25th Pctl | 50th Pctl (Median) |
75th Pctl |
|---|---|---|---|---|---|---|
| Aluminum, UNF, DCP | 01105DCP05 | 1987 | 12 | 80.3% | 87.2% | 102.0% |
| 1988 | 14 | 80.7% | 99.4% | 105.6% | ||
| 1989 | 16 | 110.1% | 117.4% | 163.6% | ||
| 1990 | 14 | 103.0% | 103.5% | 109.1% | ||
| 1991 | 33 | 91.3% | 95.2% | 114.2% | ||
| 1992 | 34 | 94.0% | 109.7% | 133.3% | ||
| 1993 | 34 | 92.4% | 105.0% | 109.4% | ||
| 1994 | 36 | 58.8% | 87.9% | 100.8% | ||
| 1995 | 60 | 58.8% | 94.1% | 117.6% | ||
| 1996 | 43 | 94.1% | 105.1% | 109.8% | ||
| 1997 | 47 | 81.8% | 97.3% | 121.6% | ||
| 1998 | 36 | 84.7% | 107.1% | 130.8% | ||
| 1999 | 12 | 96.7% | 104.4% | 131.3% |
| Hover over boxplot or outliers for additional information |
| Chart generated 03/09/2018 |
| - Aluminum, UNF, ICP-OES - |
| Lab: NWQL, PCode: 01105, MCode: PLA15 |
| Login Dates: 03/08/99 through 09/28/01 |
| Open Data Set |
| Boxplot Description |
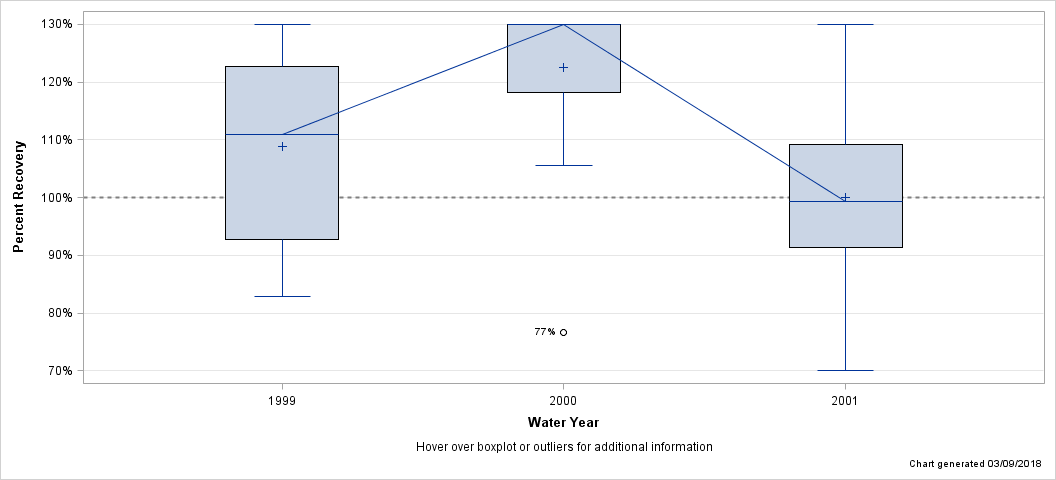
| Percent Recovery Statistics for Aluminum, UNF, ICP-OES |
| Analyte | Parm-meth Code | Water Year | # of Samples |
25th Pctl | 50th Pctl (Median) |
75th Pctl |
|---|---|---|---|---|---|---|
| Aluminum, UNF, ICP-OES | 01105PLA15 | 1999 | 13 | 92.7% | 110.9% | 122.8% |
| 2000 | 19 | 118.2% | 143.0% | 163.2% | ||
| 2001 | 24 | 91.3% | 99.4% | 109.3% |
| Hover over boxplot or outliers for additional information |
| Chart generated 03/09/2018 |
| - Antimony, FIL, GFAA - |
| Lab: NWQL, PCode: 01095, MCode: GF032 |
| Login Dates: 10/05/98 through 09/05/00 |
| Open Data Set |
| Boxplot Description |
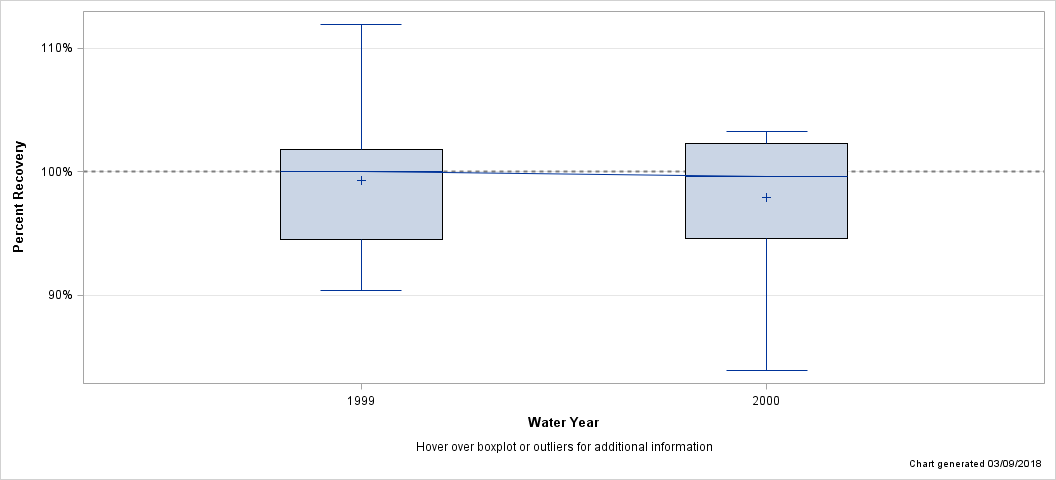
| Percent Recovery Statistics for Antimony, FIL, GFAA |
| Analyte | Parm-meth Code | Water Year | # of Samples |
25th Pctl | 50th Pctl (Median) |
75th Pctl |
|---|---|---|---|---|---|---|
| Antimony, FIL, GFAA | 01095GF032 | 1999 | 12 | 94.5% | 100.0% | 101.8% |
| 2000 | 12 | 94.6% | 99.6% | 102.3% |
| Hover over boxplot or outliers for additional information |
| Chart generated 03/09/2018 |
| - Antimony, FIL, Hydride, AA - |
| Lab: NWQL, PCode: 01095, MCode: HY009 |
| Login Dates: 01/29/87 through 09/29/98 |
| Open Data Set |
| Boxplot Description |
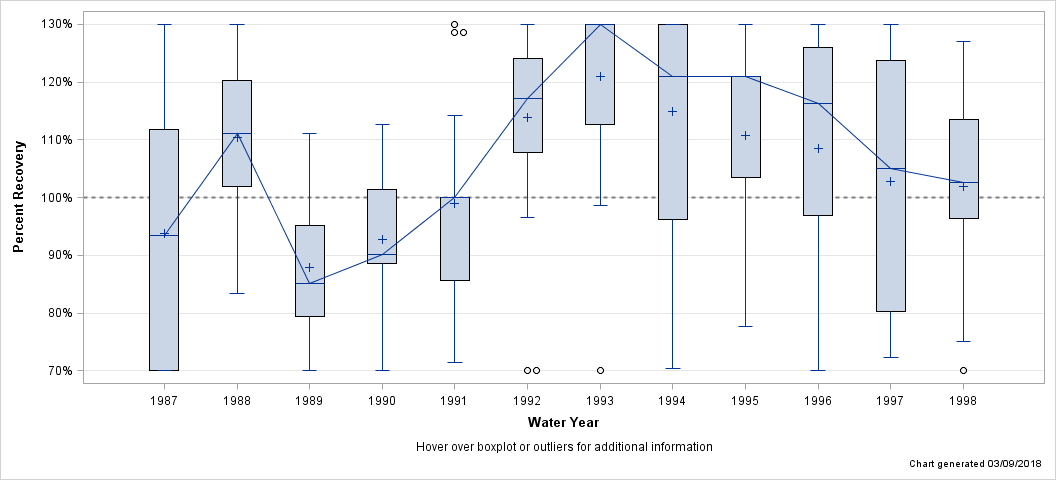
| Percent Recovery Statistics for Antimony, FIL, Hydride, AA |
| Analyte | Parm-meth Code | Water Year | # of Samples |
25th Pctl | 50th Pctl (Median) |
75th Pctl |
|---|---|---|---|---|---|---|
| Antimony, FIL, Hydride, AA | 01095HY009 | 1987 | 8 | 62.5% | 93.5% | 140.2% |
| 1988 | 21 | 101.9% | 111.1% | 120.4% | ||
| 1989 | 61 | 79.4% | 85.1% | 95.2% | ||
| 1990 | 55 | 88.6% | 90.2% | 101.5% | ||
| 1991 | 39 | 85.7% | 100.0% | 100.0% | ||
| 1992 | 47 | 107.8% | 117.3% | 124.1% | ||
| 1993 | 45 | 112.7% | 137.4% | 145.5% | ||
| 1994 | 48 | 96.2% | 121.0% | 136.2% | ||
| 1995 | 36 | 103.5% | 120.9% | 120.9% | ||
| 1996 | 22 | 96.9% | 116.3% | 126.0% | ||
| 1997 | 23 | 80.2% | 105.0% | 123.7% | ||
| 1998 | 12 | 96.3% | 102.7% | 113.6% |
| Hover over boxplot or outliers for additional information |
| Chart generated 03/09/2018 |
| - Antimony, FIL, ICP-MS - |
| Lab: NWQL, PCode: 01095, MCode: PLM43 |
| Login Dates: 02/07/94 through 09/27/01 |
| Open Data Set |
| Boxplot Description |
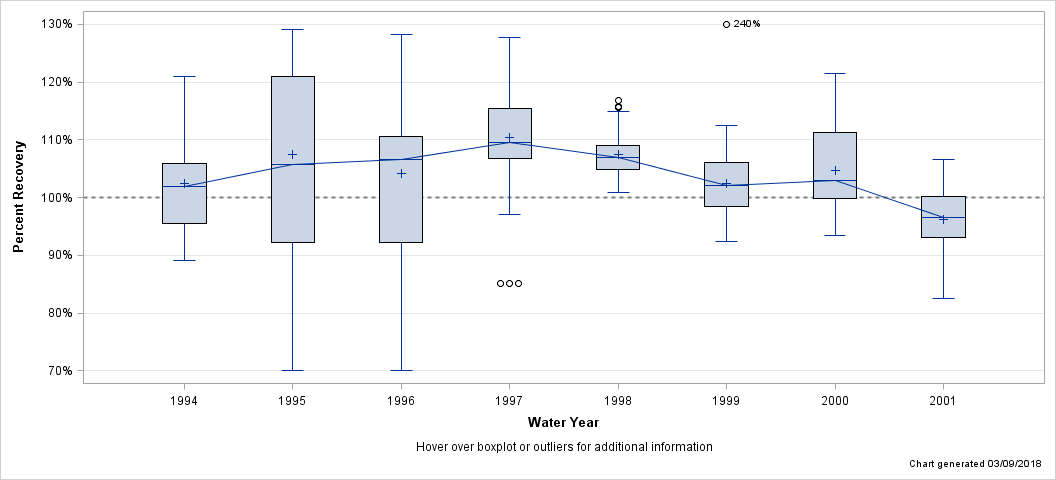
| Percent Recovery Statistics for Antimony, FIL, ICP-MS |
| Analyte | Parm-meth Code | Water Year | # of Samples |
25th Pctl | 50th Pctl (Median) |
75th Pctl |
|---|---|---|---|---|---|---|
| Antimony, FIL, ICP-MS | 01095PLM43 | 1994 | 32 | 95.5% | 101.9% | 105.9% |
| 1995 | 47 | 92.2% | 105.8% | 120.9% | ||
| 1996 | 46 | 92.2% | 106.6% | 110.6% | ||
| 1997 | 48 | 106.8% | 109.6% | 115.4% | ||
| 1998 | 96 | 105.0% | 107.0% | 109.0% | ||
| 1999 | 82 | 98.4% | 102.0% | 106.0% | ||
| 2000 | 53 | 99.9% | 102.9% | 111.3% | ||
| 2001 | 71 | 93.0% | 96.5% | 100.2% |
| Hover over boxplot or outliers for additional information |
| Chart generated 03/09/2018 |
| - Antimony, UNF, GFAA - |
| Lab: NWQL, PCode: 01097, MCode: GF031 |
| Login Dates: 10/13/98 through 09/14/99 |
| Open Data Set |
| Boxplot Description |
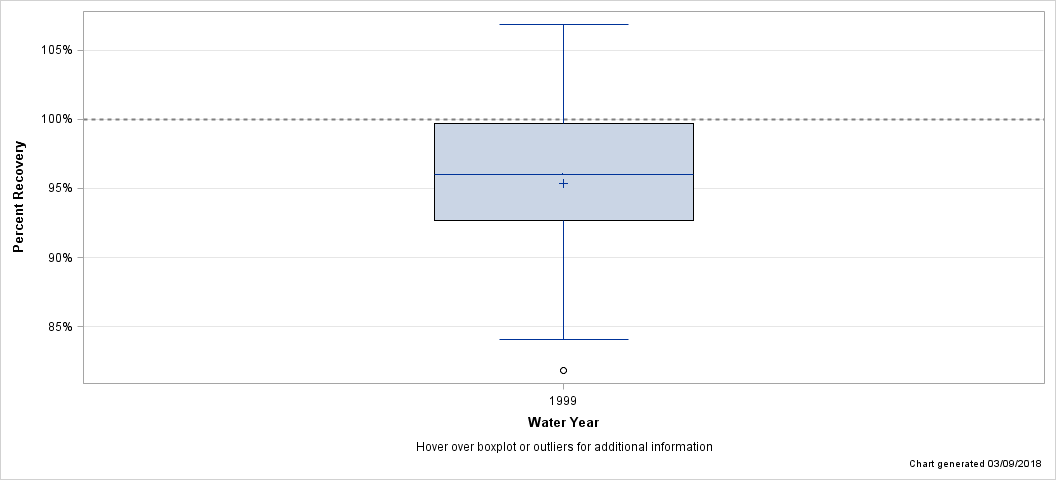
| Percent Recovery Statistics for Antimony, UNF, GFAA |
| Analyte | Parm-meth Code | Water Year | # of Samples |
25th Pctl | 50th Pctl (Median) |
75th Pctl |
|---|---|---|---|---|---|---|
| Antimony, UNF, GFAA | 01097GF031 | 1999 | 12 | 92.7% | 96.0% | 99.7% |
| Hover over boxplot or outliers for additional information |
| Chart generated 03/09/2018 |
| - Arsenic, FIL, GFAA - |
| Lab: NWQL, PCode: 01000, MCode: GF085 |
| Login Dates: 10/05/98 through 09/28/01 |
| Open Data Set |
| Boxplot Description |
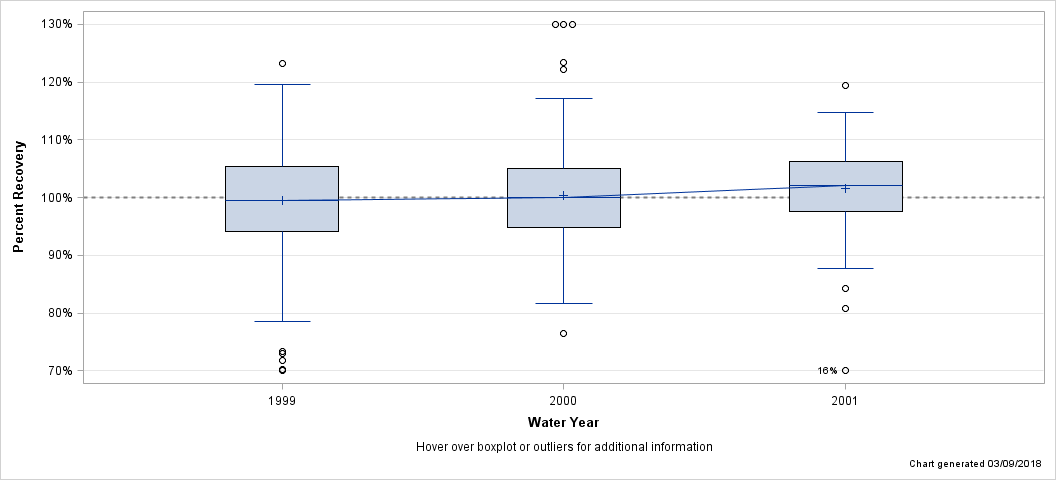
| Percent Recovery Statistics for Arsenic, FIL, GFAA |
| Analyte | Parm-meth Code | Water Year | # of Samples |
25th Pctl | 50th Pctl (Median) |
75th Pctl |
|---|---|---|---|---|---|---|
| Arsenic, FIL, GFAA | 01000GF085 | 1999 | 128 | 94.0% | 99.6% | 105.4% |
| 2000 | 100 | 94.7% | 100.0% | 105.1% | ||
| 2001 | 130 | 97.6% | 102.1% | 106.3% |
| Hover over boxplot or outliers for additional information |
| Chart generated 03/09/2018 |
| - Arsenic, FIL, Hydride, AA - |
| Lab: NWQL, PCode: 01000, MCode: HY010 |
| Login Dates: 10/14/86 through 09/29/98 |
| Open Data Set |
| Boxplot Description |
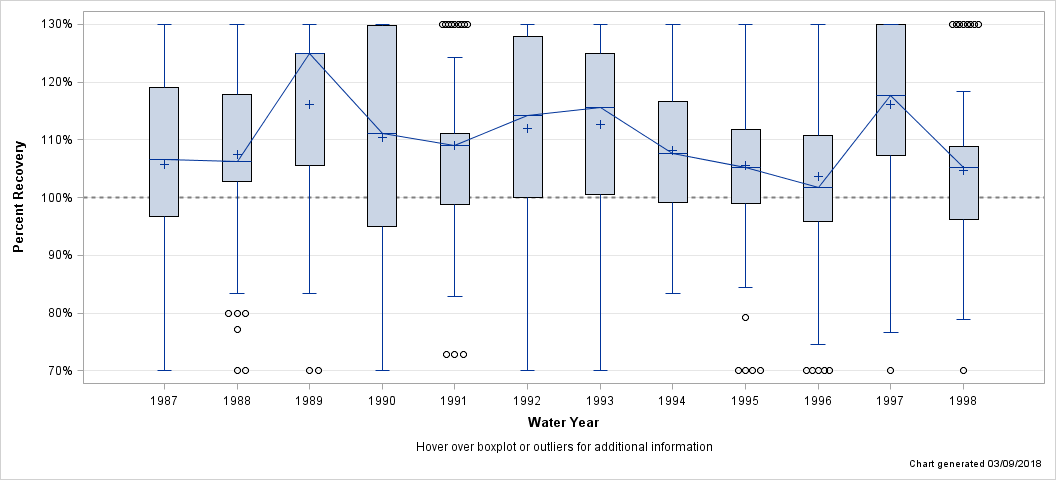
| Percent Recovery Statistics for Arsenic, FIL, Hydride, AA |
| Analyte | Parm-meth Code | Water Year | # of Samples |
25th Pctl | 50th Pctl (Median) |
75th Pctl |
|---|---|---|---|---|---|---|
| Arsenic, FIL, Hydride, AA | 01000HY010 | 1987 | 128 | 96.8% | 106.7% | 119.0% |
| 1988 | 126 | 102.8% | 106.2% | 117.9% | ||
| 1989 | 135 | 105.6% | 125.0% | 125.0% | ||
| 1990 | 184 | 95.1% | 111.1% | 129.9% | ||
| 1991 | 67 | 98.8% | 109.1% | 111.1% | ||
| 1992 | 190 | 100.0% | 114.3% | 127.9% | ||
| 1993 | 184 | 100.6% | 115.6% | 125.0% | ||
| 1994 | 168 | 99.2% | 107.6% | 116.7% | ||
| 1995 | 145 | 99.0% | 105.3% | 111.8% | ||
| 1996 | 109 | 95.9% | 101.8% | 110.7% | ||
| 1997 | 163 | 107.3% | 117.6% | 141.5% | ||
| 1998 | 72 | 96.3% | 105.3% | 108.9% |
| Hover over boxplot or outliers for additional information |
| Chart generated 03/09/2018 |
| - Arsenic, UNF, EPA - |
| Lab: NWQL, PCode: 01002, MCode: GF031 |
| Login Dates: 10/30/97 through 09/18/00 |
| Open Data Set |
| Boxplot Description |
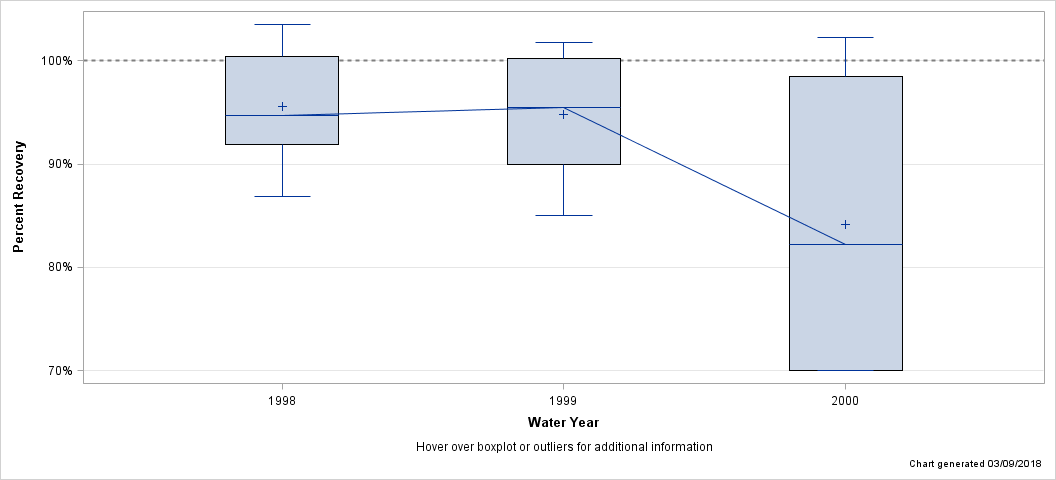
| Percent Recovery Statistics for Arsenic, UNF, EPA |
| Analyte | Parm-meth Code | Water Year | # of Samples |
25th Pctl | 50th Pctl (Median) |
75th Pctl |
|---|---|---|---|---|---|---|
| Arsenic, UNF, EPA | 01002GF031 | 1998 | 8 | 91.9% | 94.7% | 100.4% |
| 1999 | 8 | 90.0% | 95.5% | 100.2% | ||
| 2000 | 8 | 61.5% | 81.1% | 98.4% |
| Hover over boxplot or outliers for additional information |
| Chart generated 03/09/2018 |
| - Arsenic, UNF, GFAA - |
| Lab: NWQL, PCode: 01002, MCode: GF096 |
| Login Dates: 10/09/98 through 09/24/01 |
| Open Data Set |
| Boxplot Description |
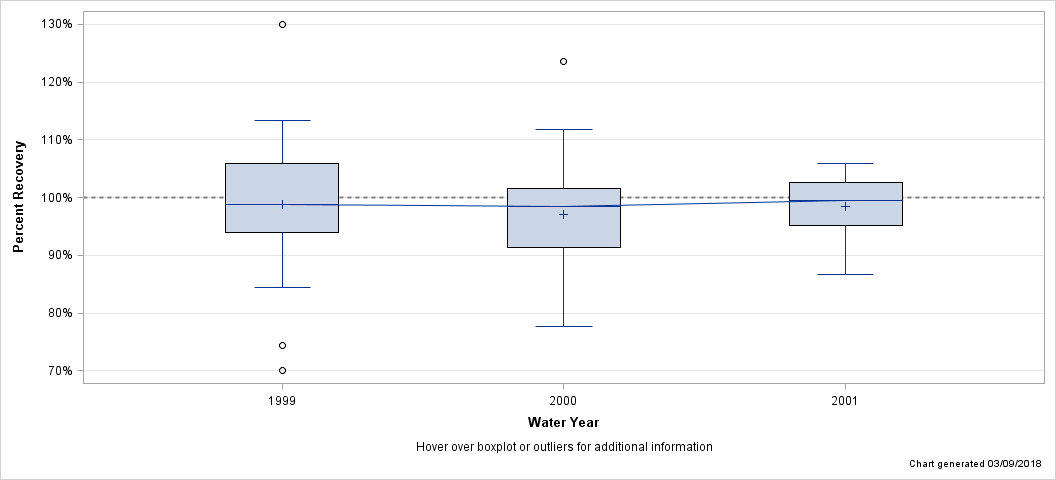
| Percent Recovery Statistics for Arsenic, UNF, GFAA |
| Analyte | Parm-meth Code | Water Year | # of Samples |
25th Pctl | 50th Pctl (Median) |
75th Pctl |
|---|---|---|---|---|---|---|
| Arsenic, UNF, GFAA | 01002GF096 | 1999 | 33 | 93.9% | 98.8% | 105.9% |
| 2000 | 25 | 91.4% | 98.5% | 101.6% | ||
| 2001 | 35 | 95.2% | 99.5% | 102.7% |
| Hover over boxplot or outliers for additional information |
| Chart generated 03/09/2018 |
| - Arsenic, UNF, GFAA-EPA - |
| Lab: NWQL, PCode: 01002, MCode: GF073 |
| Login Dates: 05/17/91 through 09/19/97 |
| Open Data Set |
| Boxplot Description |
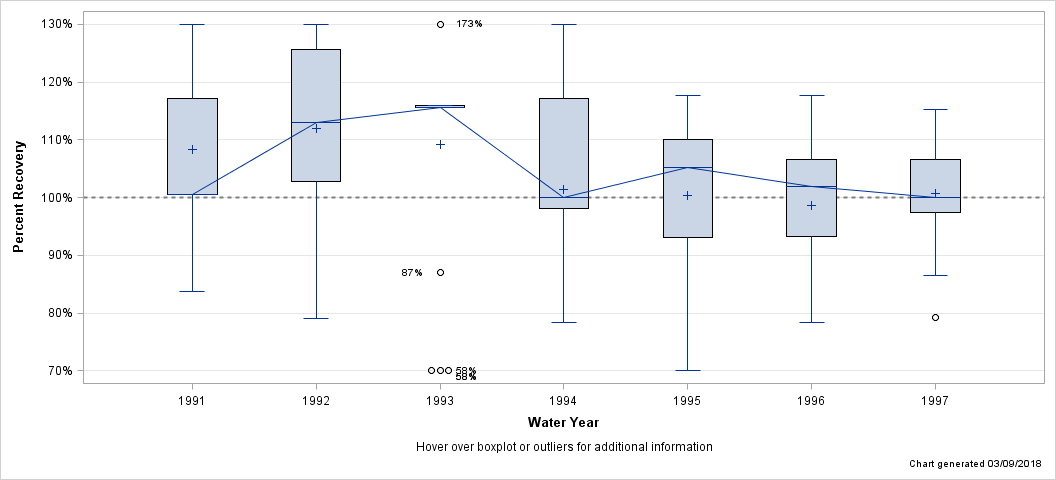
| Percent Recovery Statistics for Arsenic, UNF, GFAA-EPA |
| Analyte | Parm-meth Code | Water Year | # of Samples |
25th Pctl | 50th Pctl (Median) |
75th Pctl |
|---|---|---|---|---|---|---|
| Arsenic, UNF, GFAA-EPA | 01002GF073 | 1991 | 20 | 100.5% | 100.5% | 117.3% |
| 1992 | 24 | 102.9% | 113.0% | 125.7% | ||
| 1993 | 23 | 115.6% | 115.6% | 115.9% | ||
| 1994 | 24 | 98.0% | 100.0% | 117.2% | ||
| 1995 | 24 | 93.1% | 105.3% | 110.1% | ||
| 1996 | 11 | 93.3% | 101.9% | 106.7% | ||
| 1997 | 22 | 97.3% | 100.0% | 106.7% |
| Hover over boxplot or outliers for additional information |
| Chart generated 03/09/2018 |
| - Arsenic, UNF, Hydride, AA - |
| Lab: NWQL, PCode: 01002, MCode: HY013 |
| Login Dates: 11/12/86 through 09/24/98 |
| Open Data Set |
| Boxplot Description |
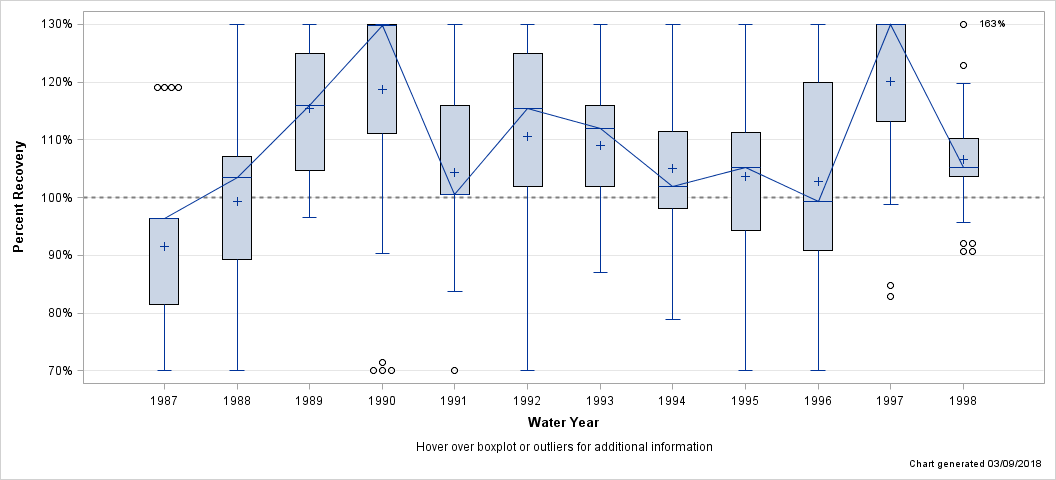
| Percent Recovery Statistics for Arsenic, UNF, Hydride, AA |
| Analyte | Parm-meth Code | Water Year | # of Samples |
25th Pctl | 50th Pctl (Median) |
75th Pctl |
|---|---|---|---|---|---|---|
| Arsenic, UNF, Hydride, AA | 01002HY013 | 1987 | 25 | 81.4% | 96.3% | 96.4% |
| 1988 | 46 | 89.3% | 103.4% | 107.1% | ||
| 1989 | 42 | 104.7% | 115.9% | 125.0% | ||
| 1990 | 75 | 111.1% | 129.9% | 131.8% | ||
| 1991 | 31 | 100.5% | 100.5% | 115.9% | ||
| 1992 | 82 | 101.9% | 115.4% | 125.0% | ||
| 1993 | 80 | 101.9% | 111.9% | 115.9% | ||
| 1994 | 60 | 98.0% | 101.9% | 111.4% | ||
| 1995 | 60 | 94.2% | 105.3% | 111.3% | ||
| 1996 | 44 | 90.9% | 99.3% | 120.0% | ||
| 1997 | 45 | 113.2% | 132.2% | 161.7% | ||
| 1998 | 40 | 103.7% | 105.3% | 110.3% |
| Hover over boxplot or outliers for additional information |
| Chart generated 03/09/2018 |
| - Barium, FIL, AA - |
| Lab: NWQL, PCode: 01005, MCode: AA003 |
| Login Dates: 11/12/86 through 03/27/96 |
| Open Data Set |
| Boxplot Description |
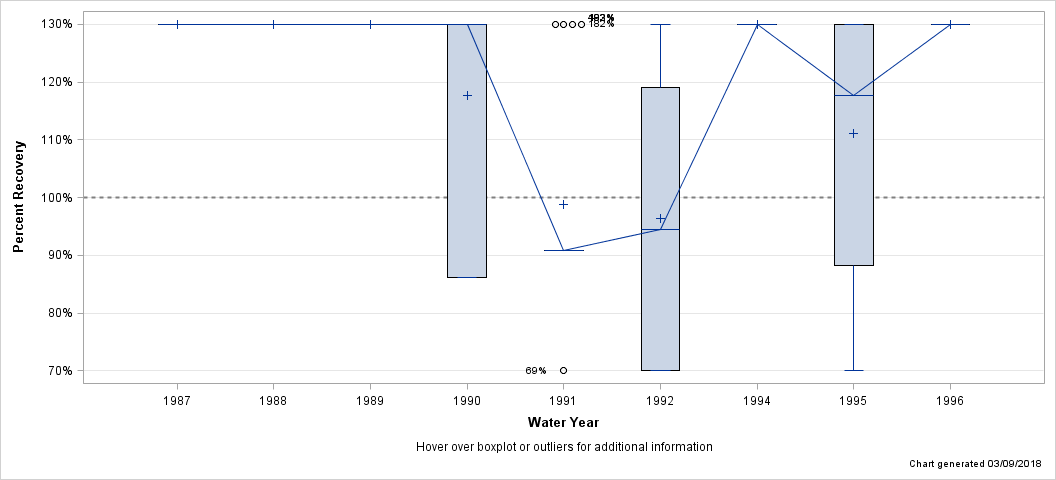
| Percent Recovery Statistics for Barium, FIL, AA |
| Analyte | Parm-meth Code | Water Year | # of Samples |
25th Pctl | 50th Pctl (Median) |
75th Pctl |
|---|---|---|---|---|---|---|
| Barium, FIL, AA | 01005AA003 | 1987 | 15 | 195.7% | 438.6% | 438.6% |
| 1988 | 22 | 176.1% | 217.4% | 510.2% | ||
| 1989 | 15 | 148.6% | 763.4% | 1546% | ||
| 1990 | 111 | 86.2% | 485.4% | 1965% | ||
| 1991 | 17 | 90.9% | 90.9% | 90.9% | ||
| 1992 | 6 | 69.0% | 94.0% | 119.0% | ||
| 1994 | 3 | 288.2% | 370.4% | 370.4% | ||
| 1995 | 36 | 88.3% | 117.8% | 575.9% | ||
| 1996 | 12 | 193.7% | 196.7% | 220.1% |
| Hover over boxplot or outliers for additional information |
| Chart generated 03/09/2018 |
| - Barium, FIL, ICP-MS - |
| Lab: NWQL, PCode: 01005, MCode: PLM43 |
| Login Dates: 02/07/94 through 09/27/01 |
| Open Data Set |
| Boxplot Description |
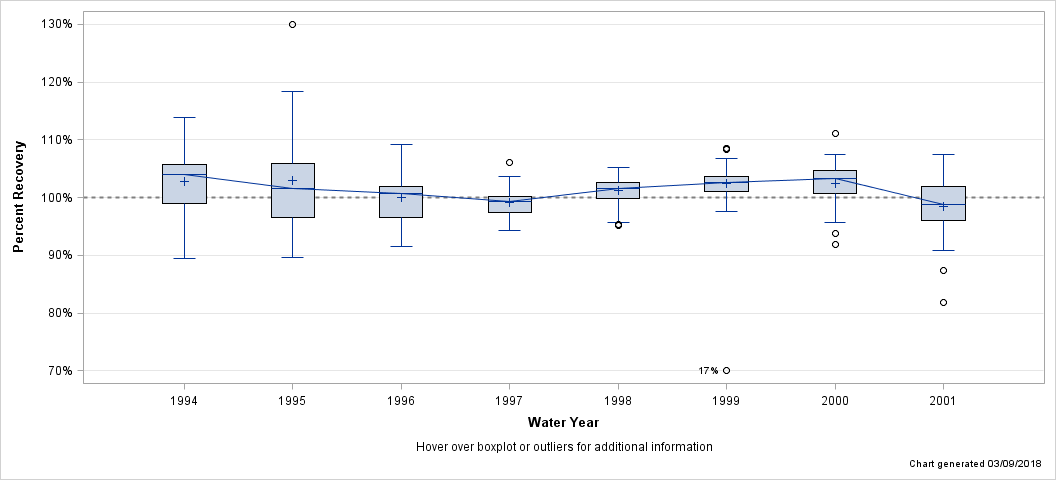
| Percent Recovery Statistics for Barium, FIL, ICP-MS |
| Analyte | Parm-meth Code | Water Year | # of Samples |
25th Pctl | 50th Pctl (Median) |
75th Pctl |
|---|---|---|---|---|---|---|
| Barium, FIL, ICP-MS | 01005PLM43 | 1994 | 32 | 99.0% | 104.1% | 105.8% |
| 1995 | 47 | 96.6% | 101.7% | 105.9% | ||
| 1996 | 46 | 96.6% | 100.7% | 101.9% | ||
| 1997 | 48 | 97.3% | 99.4% | 100.1% | ||
| 1998 | 96 | 99.8% | 101.5% | 102.7% | ||
| 1999 | 96 | 101.0% | 102.7% | 103.7% | ||
| 2000 | 72 | 100.8% | 103.4% | 104.6% | ||
| 2001 | 71 | 96.1% | 98.7% | 101.9% |
| Hover over boxplot or outliers for additional information |
| Chart generated 03/09/2018 |
| - Barium, FIL, ICP-OES - |
| Lab: NWQL, PCode: 01005, MCode: PLA11 |
| Login Dates: 10/14/86 through 09/27/01 |
| Open Data Set |
| Boxplot Description |
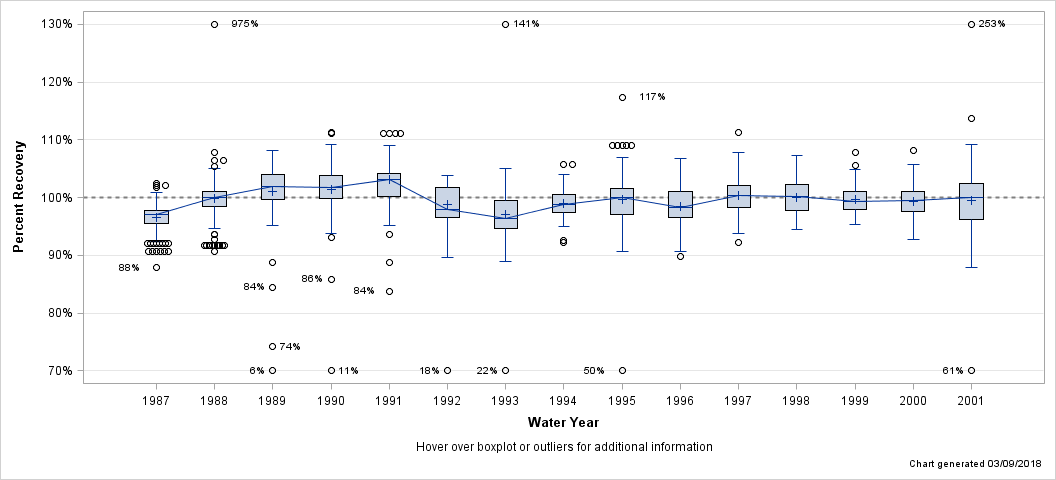
| Percent Recovery Statistics for Barium, FIL, ICP-OES |
| Analyte | Parm-meth Code | Water Year | # of Samples |
25th Pctl | 50th Pctl (Median) |
75th Pctl |
|---|---|---|---|---|---|---|
| Barium, FIL, ICP-OES | 01005PLA11 | 1987 | 162 | 95.5% | 97.1% | 97.8% |
| 1988 | 186 | 98.4% | 100.0% | 101.1% | ||
| 1989 | 123 | 99.6% | 102.0% | 104.0% | ||
| 1990 | 129 | 99.8% | 101.8% | 103.8% | ||
| 1991 | 191 | 100.2% | 103.2% | 104.1% | ||
| 1992 | 160 | 96.6% | 97.9% | 101.8% | ||
| 1993 | 178 | 94.7% | 96.3% | 99.6% | ||
| 1994 | 156 | 97.5% | 98.8% | 100.5% | ||
| 1995 | 227 | 97.1% | 99.9% | 101.7% | ||
| 1996 | 193 | 96.6% | 98.3% | 101.0% | ||
| 1997 | 117 | 98.3% | 100.3% | 102.1% | ||
| 1998 | 96 | 97.8% | 100.2% | 102.3% | ||
| 1999 | 93 | 98.0% | 99.3% | 101.0% | ||
| 2000 | 60 | 97.6% | 99.4% | 101.1% | ||
| 2001 | 52 | 96.2% | 100.0% | 102.5% |
| Hover over boxplot or outliers for additional information |
| Chart generated 03/09/2018 |
| - Barium, UNF, AA - |
| Lab: NWQL, PCode: 01007, MCode: AA042 |
| Login Dates: 10/14/86 through 09/24/97 |
| Open Data Set |
| Boxplot Description |
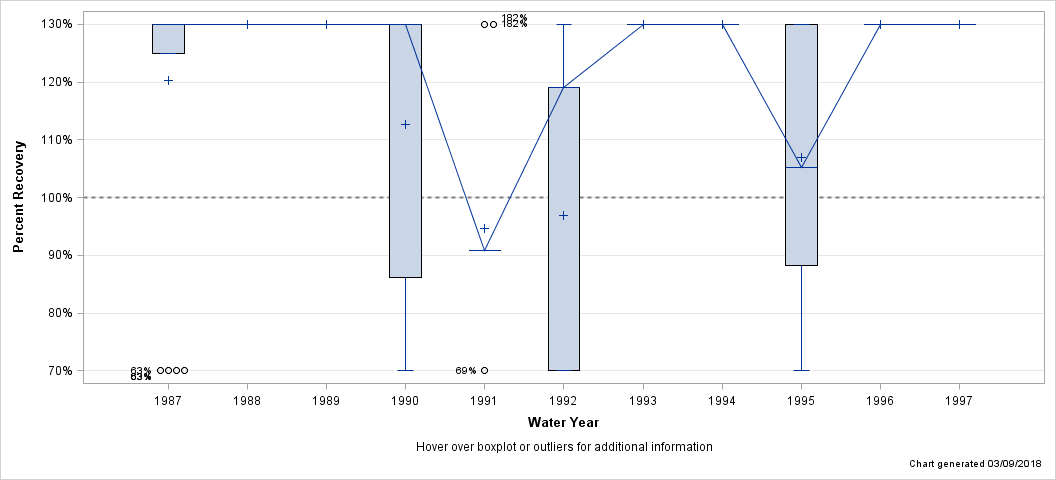
| Percent Recovery Statistics for Barium, UNF, AA |
| Analyte | Parm-meth Code | Water Year | # of Samples |
25th Pctl | 50th Pctl (Median) |
75th Pctl |
|---|---|---|---|---|---|---|
| Barium, UNF, AA | 01007AA042 | 1987 | 27 | 125.0% | 195.7% | 438.6% |
| 1988 | 46 | 145.8% | 217.4% | 510.2% | ||
| 1989 | 42 | 199.6% | 328.9% | 763.4% | ||
| 1990 | 68 | 86.2% | 1965% | 3984% | ||
| 1991 | 15 | 90.9% | 90.9% | 90.9% | ||
| 1992 | 33 | 69.0% | 119.0% | 119.0% | ||
| 1993 | 46 | 322.6% | 370.4% | 432.9% | ||
| 1994 | 24 | 370.4% | 432.9% | 1949% | ||
| 1995 | 36 | 88.3% | 105.2% | 575.9% | ||
| 1996 | 23 | 190.7% | 196.7% | 220.1% | ||
| 1997 | 21 | 196.7% | 295.0% | 295.0% |
| Hover over boxplot or outliers for additional information |
| Chart generated 03/09/2018 |
| - Barium, UNF, ICP-OES - |
| Lab: NWQL, PCode: 01007, MCode: PLA15 |
| Login Dates: 03/26/99 through 09/24/01 |
| Open Data Set |
| Boxplot Description |
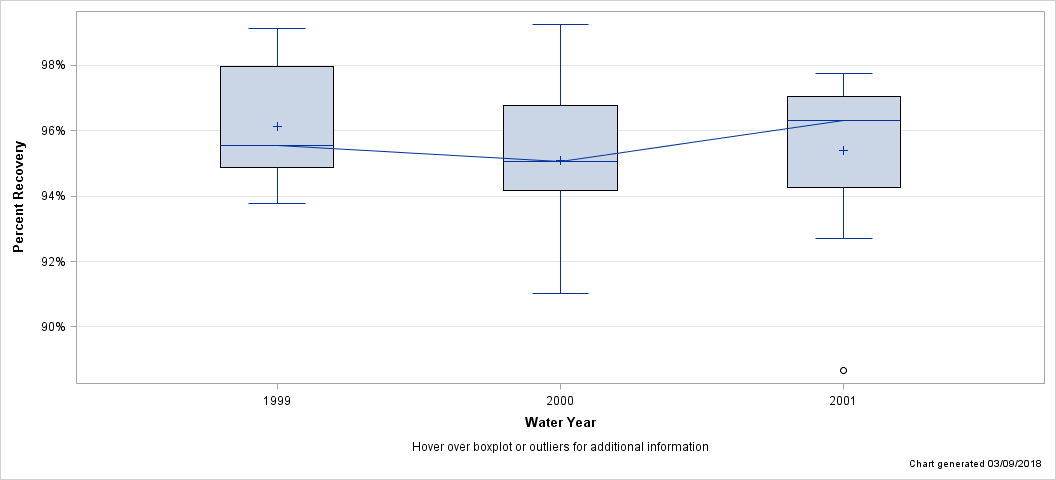
| Percent Recovery Statistics for Barium, UNF, ICP-OES |
| Analyte | Parm-meth Code | Water Year | # of Samples |
25th Pctl | 50th Pctl (Median) |
75th Pctl |
|---|---|---|---|---|---|---|
| Barium, UNF, ICP-OES | 01007PLA15 | 1999 | 13 | 94.9% | 95.5% | 98.0% |
| 2000 | 24 | 94.2% | 95.1% | 96.8% | ||
| 2001 | 23 | 94.3% | 96.3% | 97.1% |
| Hover over boxplot or outliers for additional information |
| Chart generated 03/09/2018 |
| - Beryllium, FIL, AA - |
| Lab: NWQL, PCode: 01010, MCode: AA004 |
| Login Dates: 01/11/90 through 03/27/96 |
| Open Data Set |
| Boxplot Description |
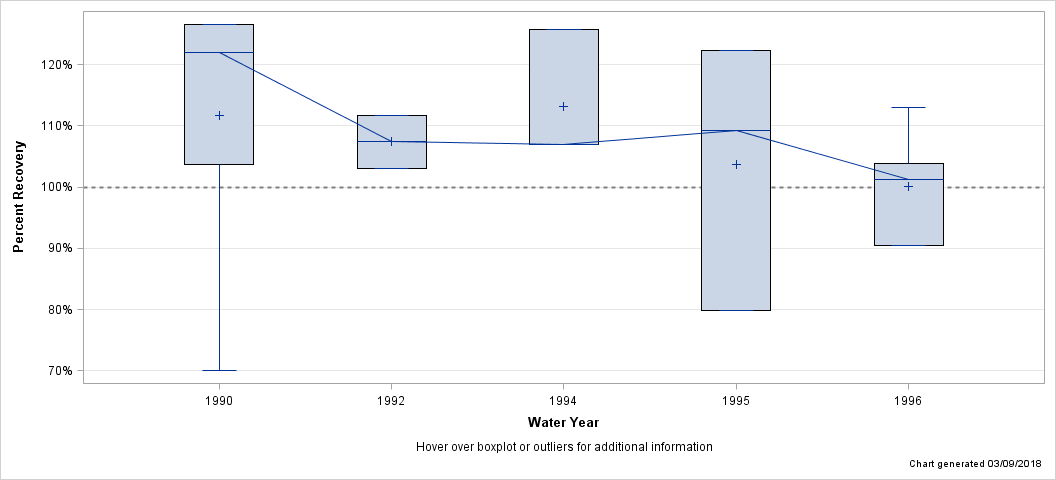
| Percent Recovery Statistics for Beryllium, FIL, AA |
| Analyte | Parm-meth Code | Water Year | # of Samples |
25th Pctl | 50th Pctl (Median) |
75th Pctl |
|---|---|---|---|---|---|---|
| Beryllium, FIL, AA | 01010AA004 | 1990 | 55 | 103.6% | 122.0% | 126.6% |
| 1992 | 6 | 103.1% | 107.4% | 111.7% | ||
| 1994 | 3 | 107.0% | 107.0% | 125.8% | ||
| 1995 | 35 | 79.8% | 109.3% | 122.3% | ||
| 1996 | 11 | 90.4% | 101.2% | 103.9% |
| Hover over boxplot or outliers for additional information |
| Chart generated 03/09/2018 |
| - Beryllium, FIL, ICP-MS - |
| Lab: NWQL, PCode: 01010, MCode: PLM43 |
| Login Dates: 02/07/94 through 08/28/01 |
| Open Data Set |
| Boxplot Description |
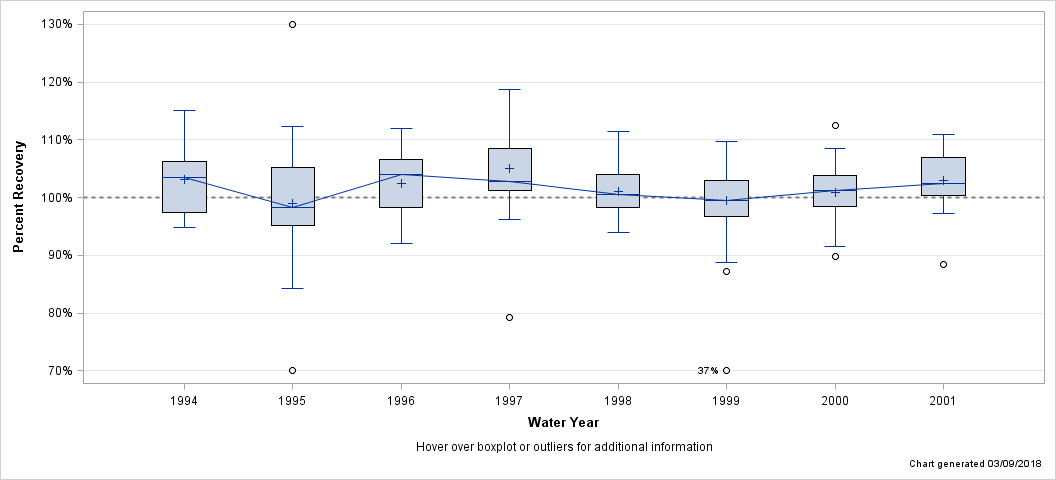
| Percent Recovery Statistics for Beryllium, FIL, ICP-MS |
| Analyte | Parm-meth Code | Water Year | # of Samples |
25th Pctl | 50th Pctl (Median) |
75th Pctl |
|---|---|---|---|---|---|---|
| Beryllium, FIL, ICP-MS | 01010PLM43 | 1994 | 32 | 97.3% | 103.4% | 106.2% |
| 1995 | 47 | 95.2% | 98.2% | 105.3% | ||
| 1996 | 46 | 98.2% | 104.0% | 106.7% | ||
| 1997 | 48 | 101.2% | 102.8% | 108.5% | ||
| 1998 | 96 | 98.3% | 100.6% | 103.9% | ||
| 1999 | 96 | 96.8% | 99.5% | 102.9% | ||
| 2000 | 40 | 98.5% | 101.2% | 103.8% | ||
| 2001 | 47 | 100.4% | 102.5% | 107.0% |
| Hover over boxplot or outliers for additional information |
| Chart generated 03/09/2018 |
| - Beryllium, FIL, ICP-OES - |
| Lab: NWQL, PCode: 01010, MCode: PLA11 |
| Login Dates: 10/14/86 through 08/23/01 |
| Open Data Set |
| Boxplot Description |
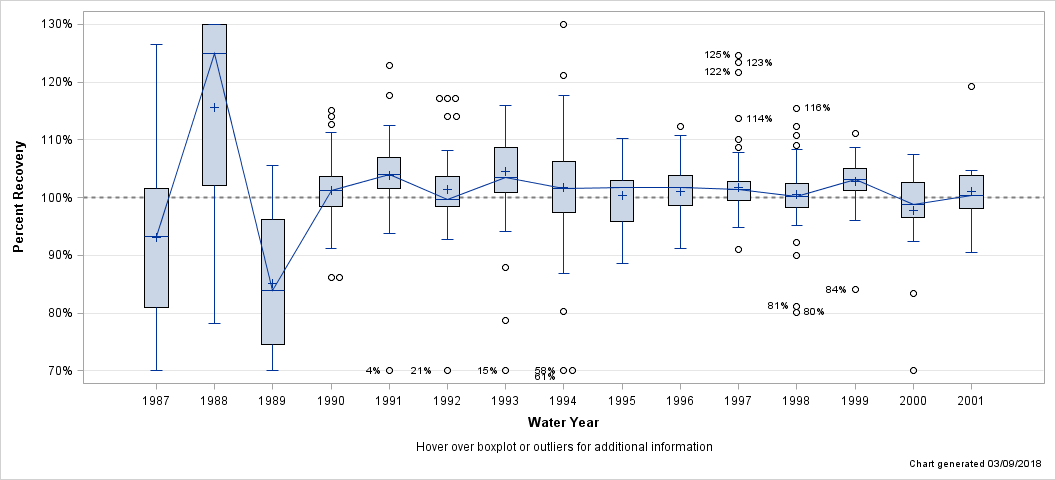
| Percent Recovery Statistics for Beryllium, FIL, ICP-OES |
| Analyte | Parm-meth Code | Water Year | # of Samples |
25th Pctl | 50th Pctl (Median) |
75th Pctl |
|---|---|---|---|---|---|---|
| Beryllium, FIL, ICP-OES | 01010PLA11 | 1987 | 85 | 80.9% | 93.2% | 101.7% |
| 1988 | 38 | 102.2% | 125.0% | 132.6% | ||
| 1989 | 45 | 74.5% | 83.9% | 96.3% | ||
| 1990 | 128 | 98.4% | 101.3% | 103.7% | ||
| 1991 | 191 | 101.6% | 104.0% | 107.0% | ||
| 1992 | 160 | 98.4% | 99.7% | 103.6% | ||
| 1993 | 178 | 100.9% | 103.4% | 108.7% | ||
| 1994 | 156 | 97.3% | 101.6% | 106.2% | ||
| 1995 | 135 | 95.8% | 101.7% | 102.9% | ||
| 1996 | 108 | 98.7% | 101.7% | 103.9% | ||
| 1997 | 117 | 99.4% | 101.4% | 102.8% | ||
| 1998 | 72 | 98.3% | 100.2% | 102.4% | ||
| 1999 | 59 | 101.2% | 103.2% | 105.0% | ||
| 2000 | 24 | 96.8% | 98.9% | 102.8% | ||
| 2001 | 24 | 98.1% | 100.3% | 103.8% |
| Hover over boxplot or outliers for additional information |
| Chart generated 03/09/2018 |
| - Beryllium, UNF, AA - |
| Lab: NWQL, PCode: 01012, MCode: AA043 |
| Login Dates: 10/14/86 through 02/16/99 |
| Open Data Set |
| Boxplot Description |
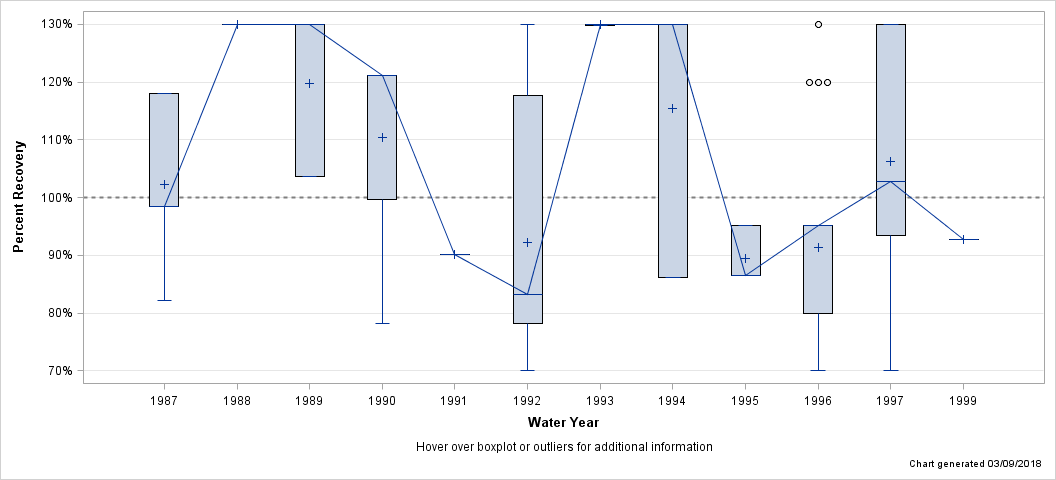
| Percent Recovery Statistics for Beryllium, UNF, AA |
| Analyte | Parm-meth Code | Water Year | # of Samples |
25th Pctl | 50th Pctl (Median) |
75th Pctl |
|---|---|---|---|---|---|---|
| Beryllium, UNF, AA | 01012AA043 | 1987 | 12 | 98.5% | 98.5% | 118.1% |
| 1988 | 18 | 138.9% | 138.9% | 138.9% | ||
| 1989 | 26 | 103.6% | 137.9% | 277.8% | ||
| 1990 | 16 | 99.7% | 121.2% | 121.2% | ||
| 1991 | 10 | 90.1% | 90.1% | 90.1% | ||
| 1992 | 26 | 78.1% | 83.2% | 117.6% | ||
| 1993 | 34 | 129.9% | 133.3% | 416.7% | ||
| 1994 | 36 | 86.2% | 133.3% | 133.3% | ||
| 1995 | 24 | 86.6% | 86.6% | 95.2% | ||
| 1996 | 21 | 80.0% | 95.2% | 95.2% | ||
| 1997 | 24 | 93.5% | 102.8% | 144.9% | ||
| 1999 | 4 | 92.8% | 92.8% | 92.8% |
| Hover over boxplot or outliers for additional information |
| Chart generated 03/09/2018 |
| - Beryllium, UNF, ICP-OES - |
| Lab: NWQL, PCode: 01012, MCode: PLA15 |
| Login Dates: 03/29/99 through 08/17/01 |
| Open Data Set |
| Boxplot Description |
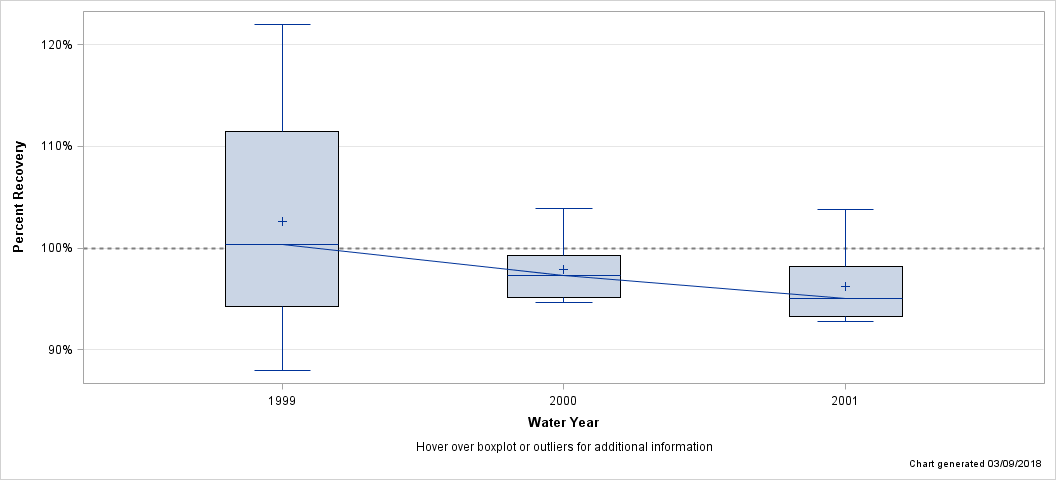
| Percent Recovery Statistics for Beryllium, UNF, ICP-OES |
| Analyte | Parm-meth Code | Water Year | # of Samples |
25th Pctl | 50th Pctl (Median) |
75th Pctl |
|---|---|---|---|---|---|---|
| Beryllium, UNF, ICP-OES | 01012PLA15 | 1999 | 13 | 94.2% | 100.4% | 111.5% |
| 2000 | 7 | 95.1% | 97.3% | 99.3% | ||
| 2001 | 8 | 93.2% | 95.0% | 98.2% |
| Hover over boxplot or outliers for additional information |
| Chart generated 03/09/2018 |
| - Boron, FIL, DCP - |
| Lab: NWQL, PCode: 01020, MCode: DCP03 |
| Login Dates: 10/15/86 through 06/05/96 |
| Open Data Set |
| Boxplot Description |
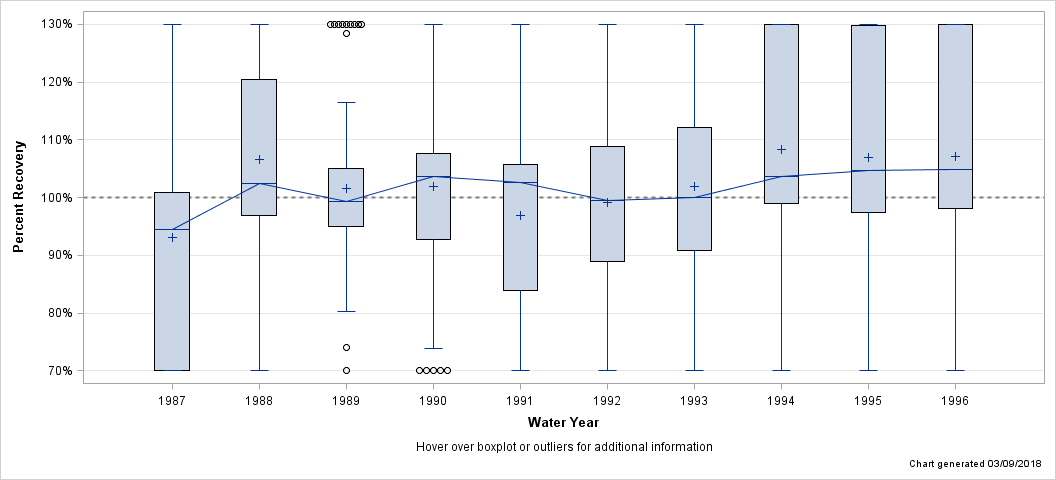
| Percent Recovery Statistics for Boron, FIL, DCP |
| Analyte | Parm-meth Code | Water Year | # of Samples |
25th Pctl | 50th Pctl (Median) |
75th Pctl |
|---|---|---|---|---|---|---|
| Boron, FIL, DCP | 01020DCP03 | 1987 | 123 | 61.7% | 94.5% | 100.9% |
| 1988 | 88 | 96.8% | 102.5% | 120.5% | ||
| 1989 | 89 | 95.0% | 99.3% | 105.0% | ||
| 1990 | 218 | 92.7% | 103.7% | 107.7% | ||
| 1991 | 176 | 83.9% | 102.6% | 105.7% | ||
| 1992 | 244 | 88.9% | 99.5% | 108.8% | ||
| 1993 | 241 | 90.9% | 100.0% | 112.1% | ||
| 1994 | 248 | 99.0% | 103.7% | 133.3% | ||
| 1995 | 216 | 97.3% | 104.6% | 134.6% | ||
| 1996 | 132 | 98.2% | 104.9% | 132.9% |
| Hover over boxplot or outliers for additional information |
| Chart generated 03/09/2018 |
| - Boron, FIL, ICP-OES - |
| Lab: NWQL, PCode: 01020, MCode: PLA13 |
| Login Dates: 06/07/96 through 09/27/01 |
| Open Data Set |
| Boxplot Description |
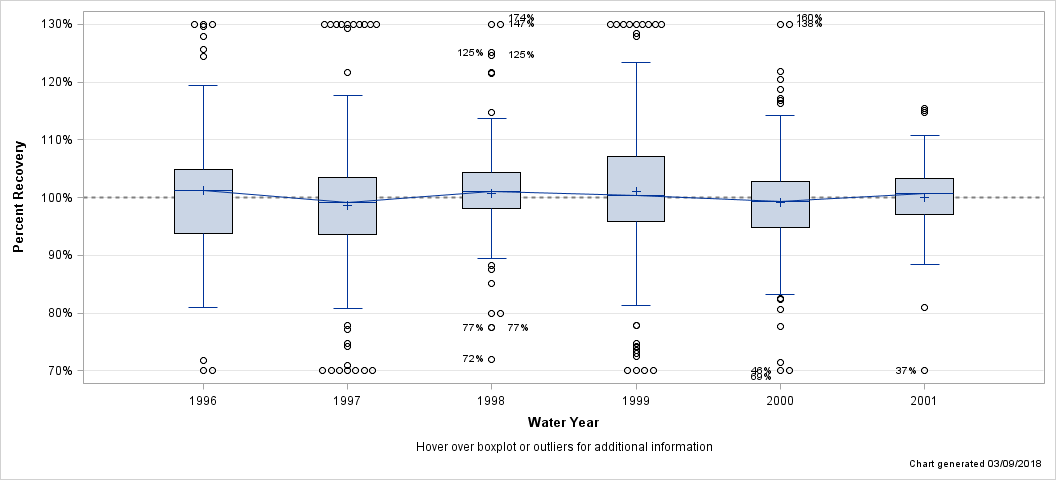
| Percent Recovery Statistics for Boron, FIL, ICP-OES |
| Analyte | Parm-meth Code | Water Year | # of Samples |
25th Pctl | 50th Pctl (Median) |
75th Pctl |
|---|---|---|---|---|---|---|
| Boron, FIL, ICP-OES | 01020PLA13 | 1996 | 67 | 93.8% | 101.3% | 104.8% |
| 1997 | 214 | 93.6% | 99.2% | 103.6% | ||
| 1998 | 160 | 98.1% | 101.1% | 104.4% | ||
| 1999 | 187 | 95.8% | 100.4% | 107.1% | ||
| 2000 | 157 | 94.9% | 99.4% | 102.9% | ||
| 2001 | 72 | 97.0% | 100.8% | 103.3% |
| Hover over boxplot or outliers for additional information |
| Chart generated 03/09/2018 |
| - Boron, UNF, DCP - |
| Lab: NWQL, PCode: 01022, MCode: DCP06 |
| Login Dates: 10/05/98 through 02/08/99 |
| Open Data Set |
| Boxplot Description |
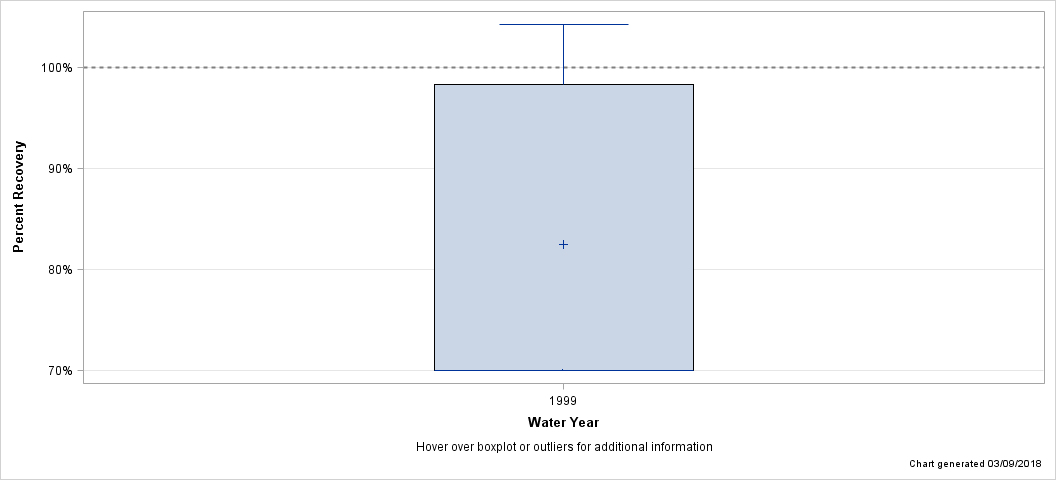
| Percent Recovery Statistics for Boron, UNF, DCP |
| Analyte | Parm-meth Code | Water Year | # of Samples |
25th Pctl | 50th Pctl (Median) |
75th Pctl |
|---|---|---|---|---|---|---|
| Boron, UNF, DCP | 01022DCP06 | 1999 | 5 | 50.2% | 51.0% | 98.3% |
| Hover over boxplot or outliers for additional information |
| Chart generated 03/09/2018 |
| - Boron, UNF, ICP-OES - |
| Lab: NWQL, PCode: 01022, MCode: PLA15 |
| Login Dates: 03/08/99 through 09/14/01 |
| Open Data Set |
| Boxplot Description |
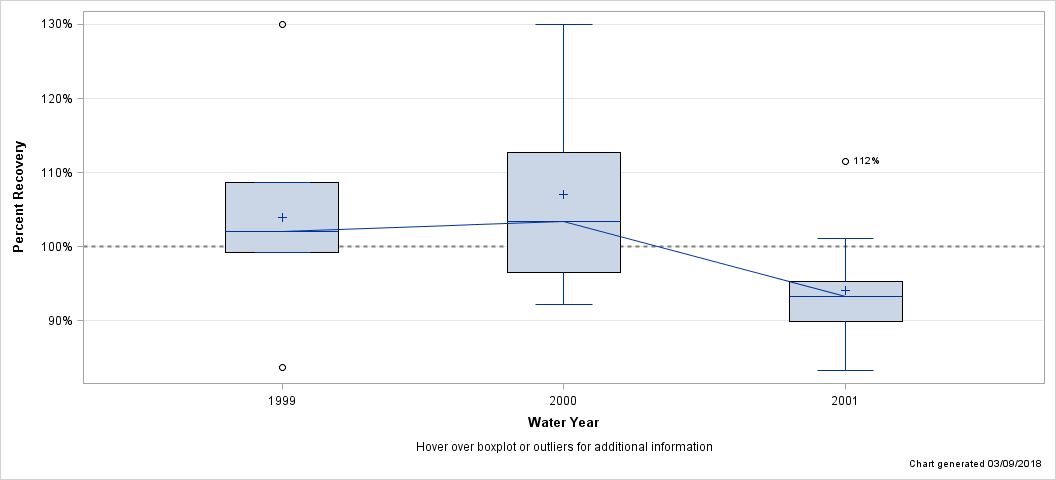
| Percent Recovery Statistics for Boron, UNF, ICP-OES |
| Analyte | Parm-meth Code | Water Year | # of Samples |
25th Pctl | 50th Pctl (Median) |
75th Pctl |
|---|---|---|---|---|---|---|
| Boron, UNF, ICP-OES | 01022PLA15 | 1999 | 7 | 99.2% | 102.0% | 108.6% |
| 2000 | 11 | 96.5% | 103.4% | 112.7% | ||
| 2001 | 12 | 89.9% | 93.3% | 95.3% |
| Hover over boxplot or outliers for additional information |
| Chart generated 03/09/2018 |
| - Cadmium, FIL - |
| Lab: NWQL, PCode: 01025, MCode: CX002 |
| Login Dates: 10/14/86 through 05/08/89 |
| Open Data Set |
| Boxplot Description |
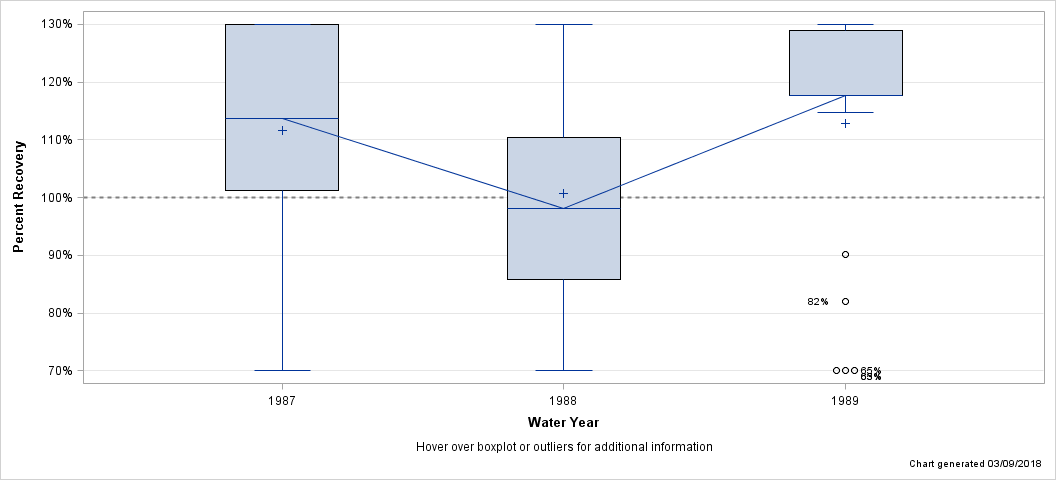
| Percent Recovery Statistics for Cadmium, FIL |
| Analyte | Parm-meth Code | Water Year | # of Samples |
25th Pctl | 50th Pctl (Median) |
75th Pctl |
|---|---|---|---|---|---|---|
| Cadmium, FIL | 01025CX002 | 1987 | 34 | 101.2% | 113.6% | 248.8% |
| 1988 | 45 | 85.9% | 98.2% | 110.4% | ||
| 1989 | 25 | 117.6% | 117.6% | 129.0% |
| Hover over boxplot or outliers for additional information |
| Chart generated 03/09/2018 |
| - Cadmium, FIL, GFAA - |
| Lab: NWQL, PCode: 01025, MCode: GF086 |
| Login Dates: 05/15/89 through 09/24/01 |
| Open Data Set |
| Boxplot Description |
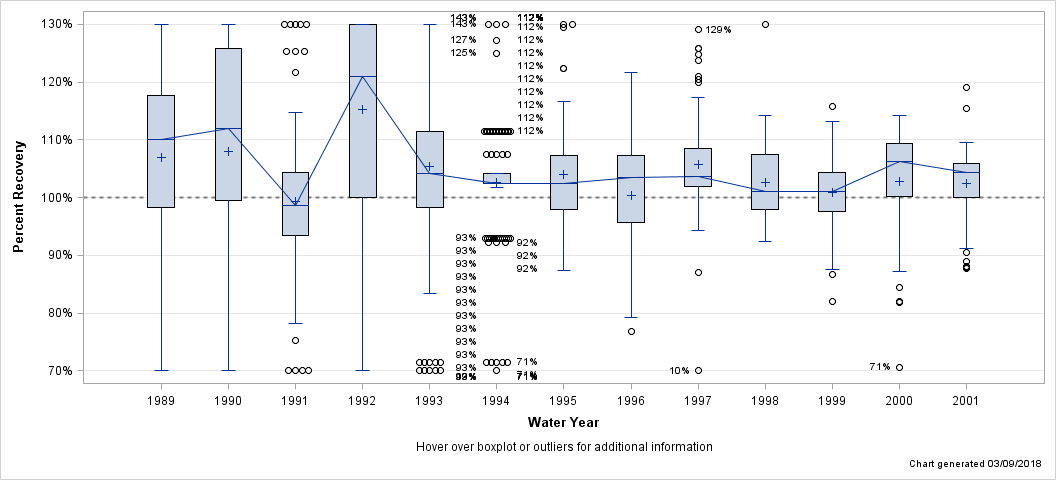
| Percent Recovery Statistics for Cadmium, FIL, GFAA |
| Analyte | Parm-meth Code | Water Year | # of Samples |
25th Pctl | 50th Pctl (Median) |
75th Pctl |
|---|---|---|---|---|---|---|
| Cadmium, FIL, GFAA | 01025GF086 | 1989 | 48 | 98.4% | 110.1% | 117.6% |
| 1990 | 182 | 99.5% | 111.9% | 125.9% | ||
| 1991 | 85 | 93.5% | 98.6% | 104.4% | ||
| 1992 | 142 | 100.0% | 121.0% | 157.5% | ||
| 1993 | 141 | 98.2% | 104.2% | 111.4% | ||
| 1994 | 121 | 102.4% | 102.4% | 104.2% | ||
| 1995 | 110 | 97.9% | 102.4% | 107.4% | ||
| 1996 | 87 | 95.7% | 103.4% | 107.4% | ||
| 1997 | 92 | 101.9% | 103.7% | 108.5% | ||
| 1998 | 48 | 98.0% | 101.0% | 107.4% | ||
| 1999 | 48 | 97.6% | 101.0% | 104.3% | ||
| 2000 | 48 | 100.1% | 106.2% | 109.3% | ||
| 2001 | 47 | 99.9% | 104.3% | 105.8% |
| Hover over boxplot or outliers for additional information |
| Chart generated 03/09/2018 |
| - Cadmium, FIL, ICP-MS - |
| Lab: NWQL, PCode: 01025, MCode: PLM43 |
| Login Dates: 02/07/94 through 09/27/01 |
| Open Data Set |
| Boxplot Description |
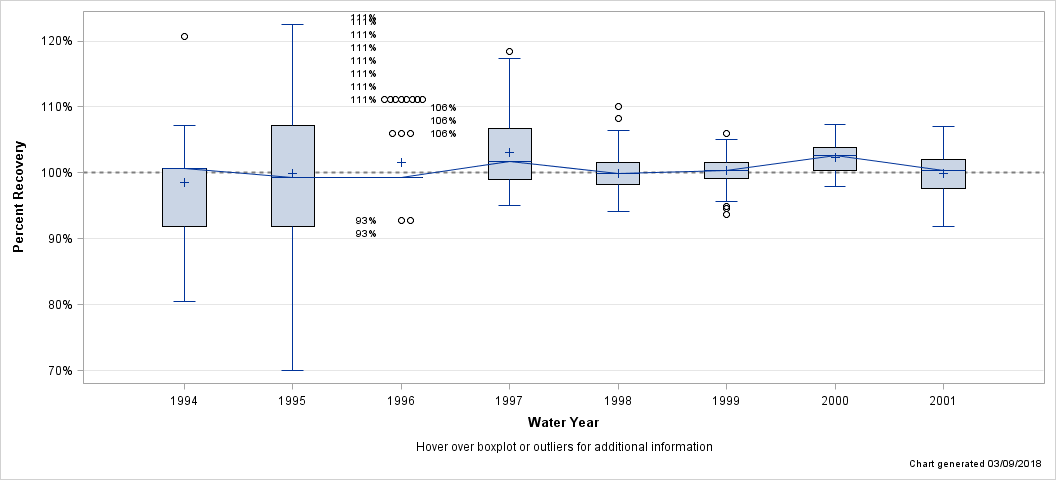
| Percent Recovery Statistics for Cadmium, FIL, ICP-MS |
| Analyte | Parm-meth Code | Water Year | # of Samples |
25th Pctl | 50th Pctl (Median) |
75th Pctl |
|---|---|---|---|---|---|---|
| Cadmium, FIL, ICP-MS | 01025PLM43 | 1994 | 32 | 91.9% | 100.6% | 100.6% |
| 1995 | 47 | 91.9% | 99.3% | 107.2% | ||
| 1996 | 46 | 99.3% | 99.3% | 99.3% | ||
| 1997 | 48 | 99.0% | 101.8% | 106.7% | ||
| 1998 | 96 | 98.3% | 100.0% | 101.6% | ||
| 1999 | 96 | 99.1% | 100.3% | 101.6% | ||
| 2000 | 72 | 100.4% | 102.6% | 103.9% | ||
| 2001 | 71 | 97.6% | 100.3% | 102.1% |
| Hover over boxplot or outliers for additional information |
| Chart generated 03/09/2018 |
| - Cadmium, FIL, ICP-OES - |
| Lab: NWQL, PCode: 01025, MCode: PLA11 |
| Login Dates: 10/14/86 through 09/27/01 |
| Open Data Set |
| Boxplot Description |
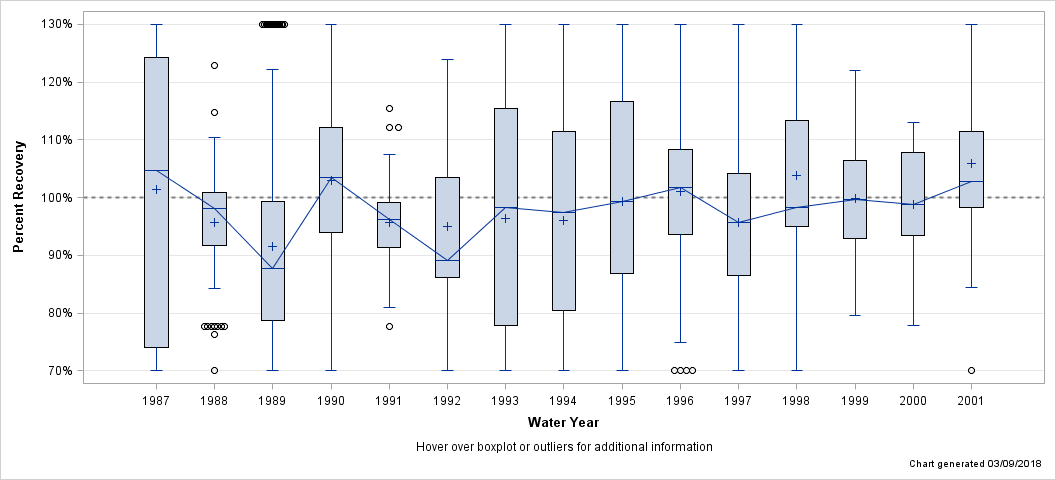
| Percent Recovery Statistics for Cadmium, FIL, ICP-OES |
| Analyte | Parm-meth Code | Water Year | # of Samples |
25th Pctl | 50th Pctl (Median) |
75th Pctl |
|---|---|---|---|---|---|---|
| Cadmium, FIL, ICP-OES | 01025PLA11 | 1987 | 162 | 74.1% | 104.7% | 124.2% |
| 1988 | 186 | 91.7% | 98.2% | 100.9% | ||
| 1989 | 123 | 78.7% | 87.7% | 99.2% | ||
| 1990 | 130 | 93.9% | 103.4% | 112.1% | ||
| 1991 | 191 | 91.4% | 96.2% | 99.2% | ||
| 1992 | 133 | 86.2% | 89.2% | 103.4% | ||
| 1993 | 132 | 77.8% | 98.2% | 115.4% | ||
| 1994 | 134 | 80.5% | 97.5% | 111.4% | ||
| 1995 | 135 | 86.9% | 99.3% | 116.6% | ||
| 1996 | 96 | 93.6% | 101.7% | 108.3% | ||
| 1997 | 96 | 86.4% | 95.7% | 104.2% | ||
| 1998 | 61 | 95.1% | 98.3% | 113.4% | ||
| 1999 | 69 | 93.0% | 99.7% | 106.4% | ||
| 2000 | 36 | 93.4% | 98.9% | 107.8% | ||
| 2001 | 33 | 98.3% | 102.8% | 111.4% |
| Hover over boxplot or outliers for additional information |
| Chart generated 03/09/2018 |
| - Cadmium, FILS, GFAA, LL - |
| Lab: NWQL, PCode: 01025, MCode: GF074 |
| Login Dates: 03/06/87 through 09/13/95 |
| Open Data Set |
| Boxplot Description |
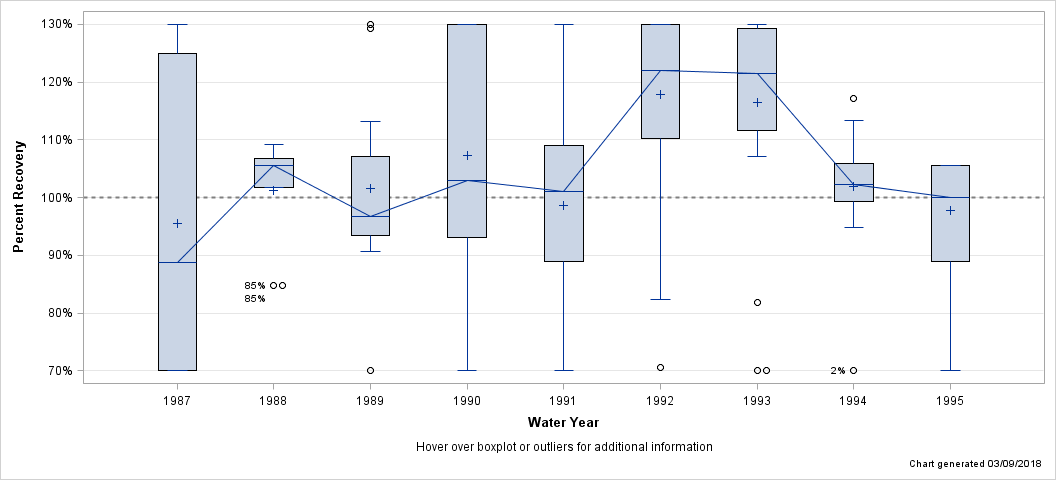
| Percent Recovery Statistics for Cadmium, FILS, GFAA, LL |
| Analyte | Parm-meth Code | Water Year | # of Samples |
25th Pctl | 50th Pctl (Median) |
75th Pctl |
|---|---|---|---|---|---|---|
| Cadmium, FILS, GFAA, LL | 01025GF074 | 1987 | 6 | 66.0% | 88.8% | 125.0% |
| 1988 | 9 | 101.7% | 105.6% | 106.7% | ||
| 1989 | 13 | 93.5% | 96.8% | 107.1% | ||
| 1990 | 17 | 93.1% | 103.0% | 159.6% | ||
| 1991 | 21 | 88.9% | 101.0% | 109.1% | ||
| 1992 | 24 | 110.2% | 122.0% | 141.2% | ||
| 1993 | 24 | 111.7% | 121.4% | 137.0% | ||
| 1994 | 24 | 99.3% | 102.2% | 105.9% | ||
| 1995 | 11 | 88.9% | 100.0% | 105.6% |
| Hover over boxplot or outliers for additional information |
| Chart generated 03/09/2018 |
| - Cadmium, UNF - |
| Lab: NWQL, PCode: 01027, MCode: CX013 |
| Login Dates: 10/14/86 through 04/27/89 |
| Open Data Set |
| Boxplot Description |
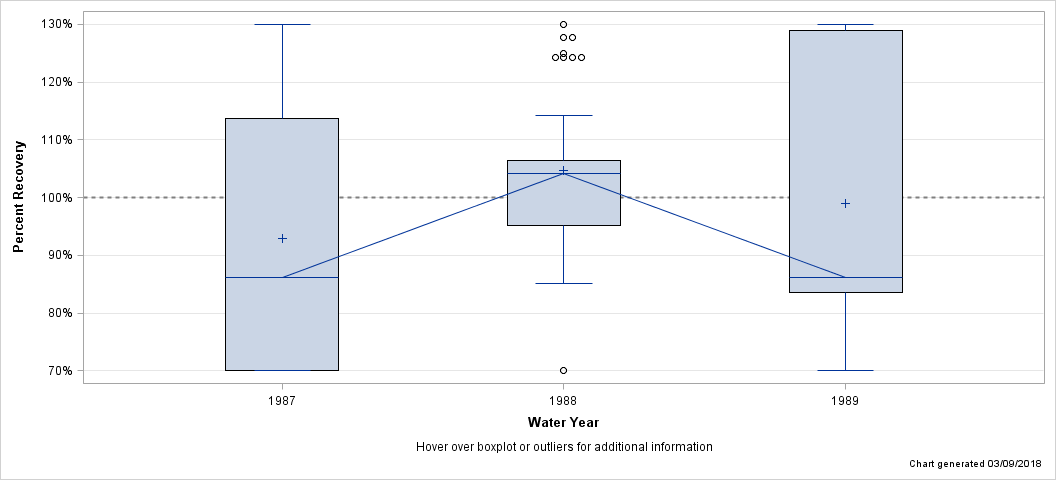
| Percent Recovery Statistics for Cadmium, UNF |
| Analyte | Parm-meth Code | Water Year | # of Samples |
25th Pctl | 50th Pctl (Median) |
75th Pctl |
|---|---|---|---|---|---|---|
| Cadmium, UNF | 01027CX013 | 1987 | 27 | 56.8% | 86.2% | 113.6% |
| 1988 | 44 | 95.2% | 104.2% | 106.4% | ||
| 1989 | 20 | 83.5% | 86.2% | 129.0% |
| Hover over boxplot or outliers for additional information |
| Chart generated 03/09/2018 |
| - Cadmium, UNF, GFAA - |
| Lab: NWQL, PCode: 01027, MCode: GF097 |
| Login Dates: 05/08/89 through 09/28/01 |
| Open Data Set |
| Boxplot Description |
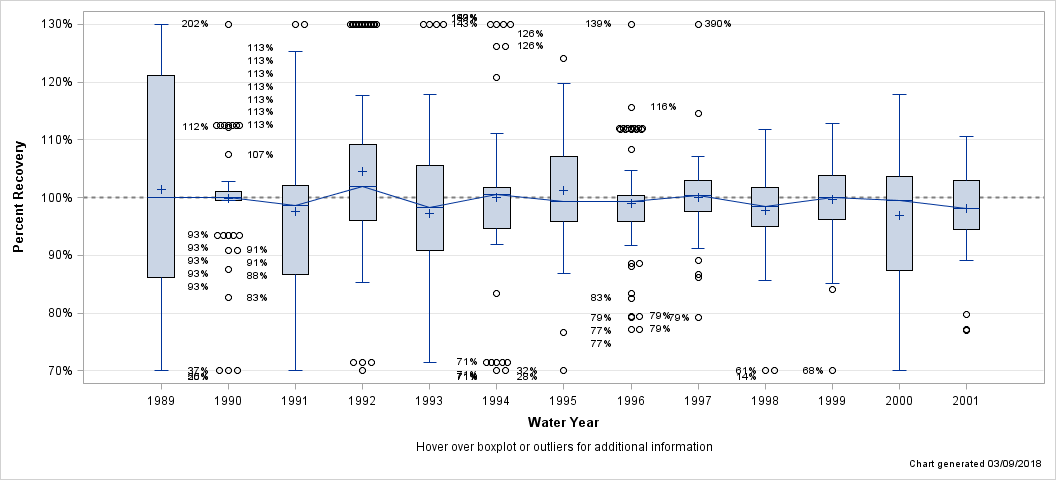
| Percent Recovery Statistics for Cadmium, UNF, GFAA |
| Analyte | Parm-meth Code | Water Year | # of Samples |
25th Pctl | 50th Pctl (Median) |
75th Pctl |
|---|---|---|---|---|---|---|
| Cadmium, UNF, GFAA | 01027GF097 | 1989 | 22 | 86.2% | 100.0% | 121.2% |
| 1990 | 68 | 99.5% | 100.0% | 101.0% | ||
| 1991 | 73 | 86.7% | 98.6% | 102.2% | ||
| 1992 | 82 | 95.9% | 101.9% | 109.2% | ||
| 1993 | 80 | 90.9% | 98.2% | 105.5% | ||
| 1994 | 120 | 94.6% | 100.6% | 101.8% | ||
| 1995 | 120 | 95.9% | 99.3% | 107.2% | ||
| 1996 | 102 | 95.9% | 99.3% | 100.3% | ||
| 1997 | 93 | 97.6% | 100.4% | 103.0% | ||
| 1998 | 72 | 95.0% | 98.5% | 101.8% | ||
| 1999 | 72 | 96.1% | 100.1% | 103.9% | ||
| 2000 | 59 | 87.3% | 99.5% | 103.7% | ||
| 2001 | 57 | 94.5% | 98.0% | 103.0% |
| Hover over boxplot or outliers for additional information |
| Chart generated 03/09/2018 |
| - Chromium, FIL - |
| Lab: NWQL, PCode: 01030, MCode: AA011 |
| Login Dates: 10/14/86 through 11/16/87 |
| Open Data Set |
| Boxplot Description |
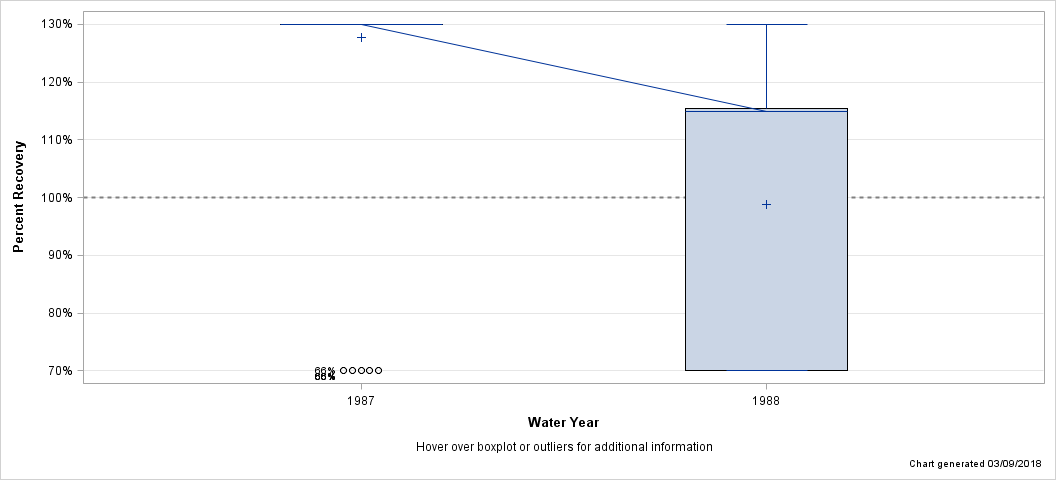
| Percent Recovery Statistics for Chromium, FIL |
| Analyte | Parm-meth Code | Water Year | # of Samples |
25th Pctl | 50th Pctl (Median) |
75th Pctl |
|---|---|---|---|---|---|---|
| Chromium, FIL | 01030AA011 | 1987 | 128 | 152.2% | 256.4% | 357.1% |
| 1988 | 17 | 61.3% | 114.9% | 115.4% |
| Hover over boxplot or outliers for additional information |
| Chart generated 03/09/2018 |
| - Chromium, FIL, DCP - |
| Lab: NWQL, PCode: 01030, MCode: DCP04 |
| Login Dates: 12/01/87 through 12/23/93 |
| Open Data Set |
| Boxplot Description |
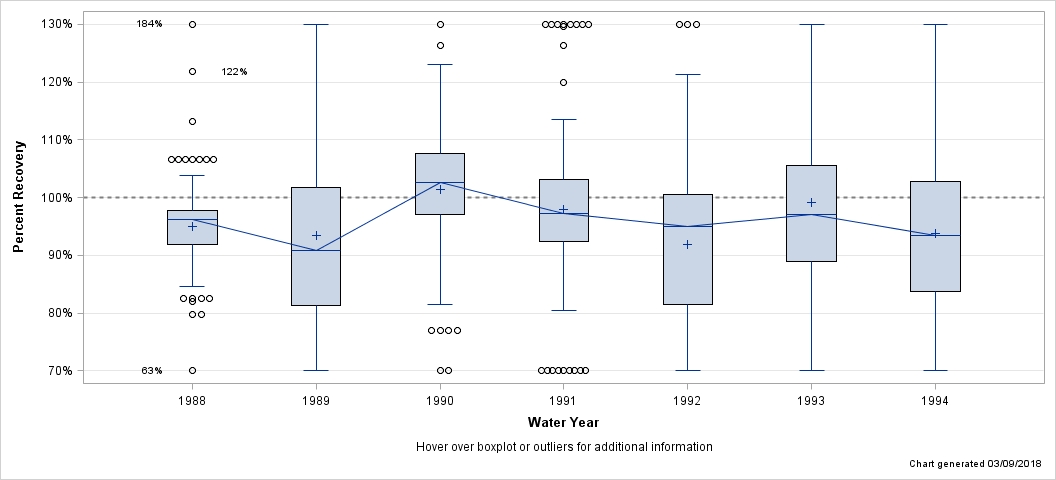
| Percent Recovery Statistics for Chromium, FIL, DCP |
| Analyte | Parm-meth Code | Water Year | # of Samples |
25th Pctl | 50th Pctl (Median) |
75th Pctl |
|---|---|---|---|---|---|---|
| Chromium, FIL, DCP | 01030DCP04 | 1988 | 110 | 92.0% | 96.2% | 97.7% |
| 1989 | 80 | 81.3% | 90.9% | 101.8% | ||
| 1990 | 215 | 97.1% | 102.6% | 107.7% | ||
| 1991 | 109 | 92.3% | 97.2% | 103.1% | ||
| 1992 | 121 | 81.5% | 95.0% | 100.6% | ||
| 1993 | 140 | 88.9% | 97.0% | 105.6% | ||
| 1994 | 41 | 83.7% | 93.5% | 102.8% |
| Hover over boxplot or outliers for additional information |
| Chart generated 03/09/2018 |
| - Chromium, FIL, GFAA - |
| Lab: NWQL, PCode: 01030, MCode: GF075 |
| Login Dates: 12/28/93 through 09/27/01 |
| Open Data Set |
| Boxplot Description |
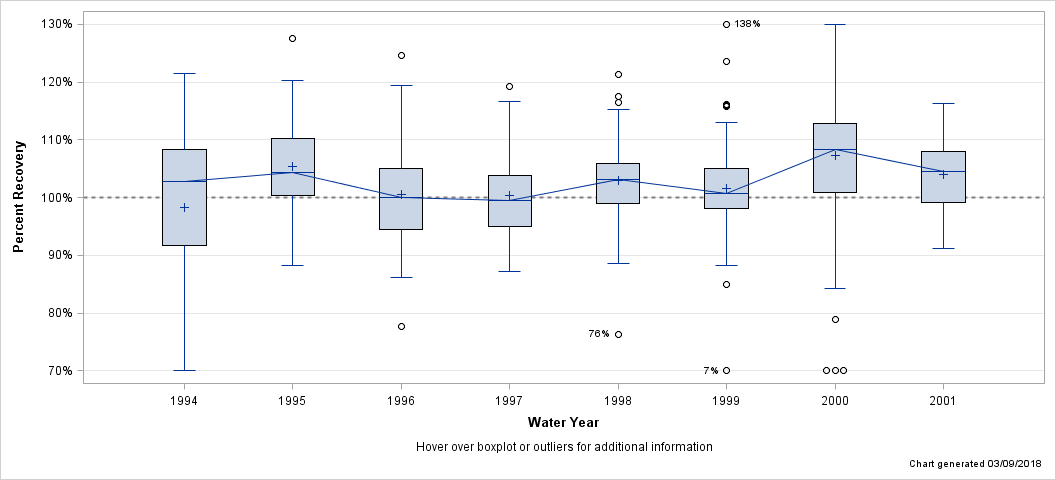
| Percent Recovery Statistics for Chromium, FIL, GFAA |
| Analyte | Parm-meth Code | Water Year | # of Samples |
25th Pctl | 50th Pctl (Median) |
75th Pctl |
|---|---|---|---|---|---|---|
| Chromium, FIL, GFAA | 01030GF075 | 1994 | 140 | 91.7% | 102.8% | 108.4% |
| 1995 | 170 | 100.4% | 104.3% | 110.3% | ||
| 1996 | 145 | 94.5% | 100.0% | 105.1% | ||
| 1997 | 104 | 95.0% | 99.5% | 103.9% | ||
| 1998 | 48 | 99.0% | 103.1% | 105.9% | ||
| 1999 | 94 | 98.0% | 100.6% | 105.0% | ||
| 2000 | 101 | 100.9% | 108.3% | 112.9% | ||
| 2001 | 118 | 99.1% | 104.6% | 107.9% |
| Hover over boxplot or outliers for additional information |
| Chart generated 03/09/2018 |
| - Chromium, FIL, GFAA, LL - |
| Lab: NWQL, PCode: 01030, MCode: GF076 |
| Login Dates: 11/24/89 through 09/27/94 |
| Open Data Set |
| Boxplot Description |
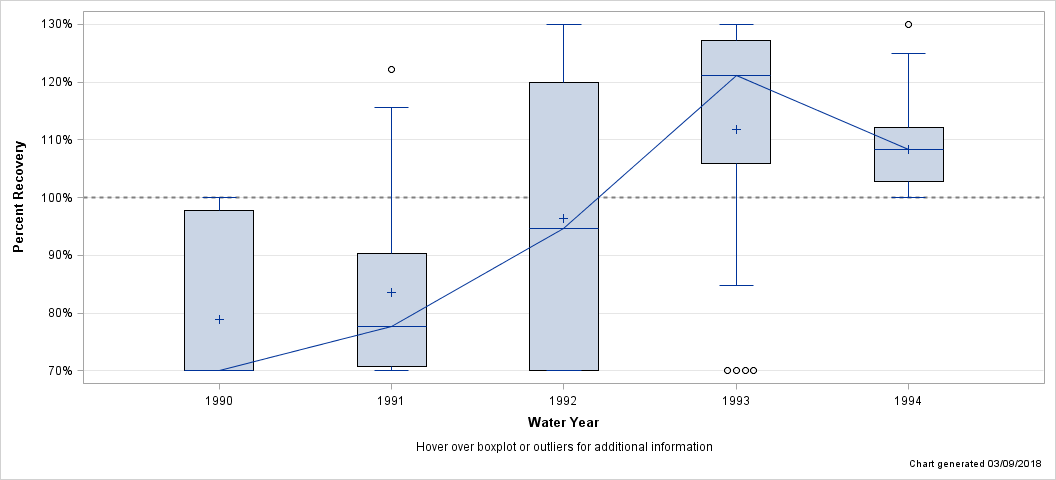
| Percent Recovery Statistics for Chromium, FIL, GFAA, LL |
| Analyte | Parm-meth Code | Water Year | # of Samples |
25th Pctl | 50th Pctl (Median) |
75th Pctl |
|---|---|---|---|---|---|---|
| Chromium, FIL, GFAA, LL | 01030GF076 | 1990 | 15 | 50.0% | 66.7% | 97.8% |
| 1991 | 20 | 70.8% | 77.6% | 90.3% | ||
| 1992 | 24 | 65.6% | 94.7% | 120.0% | ||
| 1993 | 24 | 105.8% | 121.2% | 127.2% | ||
| 1994 | 18 | 102.8% | 108.3% | 112.1% |
| Hover over boxplot or outliers for additional information |
| Chart generated 03/09/2018 |
| - Chromium, FIL, ICP-MS - |
| Lab: NWQL, PCode: 01030, MCode: PLM40 |
| Login Dates: 02/07/94 through 05/09/00 |
| Open Data Set |
| Boxplot Description |
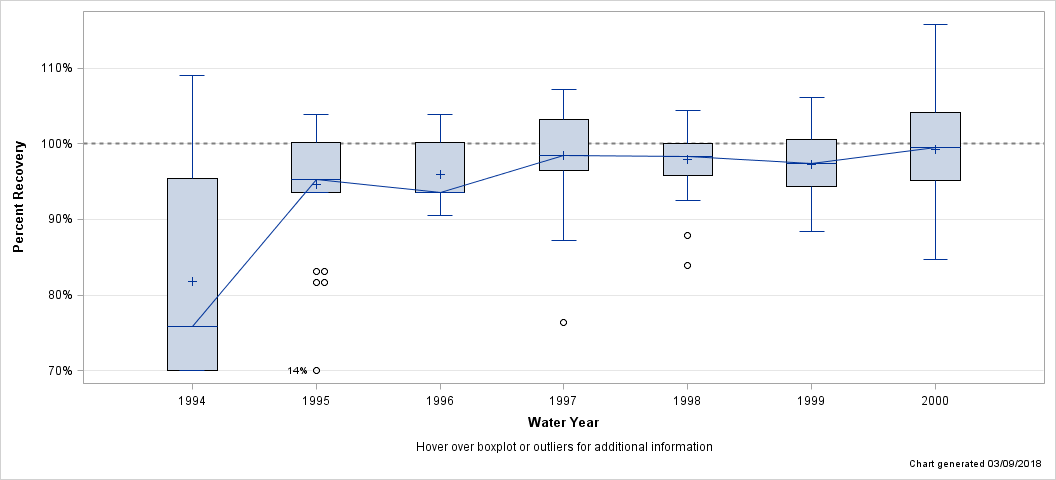
| Percent Recovery Statistics for Chromium, FIL, ICP-MS |
| Analyte | Parm-meth Code | Water Year | # of Samples |
25th Pctl | 50th Pctl (Median) |
75th Pctl |
|---|---|---|---|---|---|---|
| Chromium, FIL, ICP-MS | 01030PLM40 | 1994 | 32 | 69.7% | 75.7% | 95.4% |
| 1995 | 47 | 93.5% | 95.3% | 100.2% | ||
| 1996 | 46 | 93.5% | 93.5% | 100.2% | ||
| 1997 | 48 | 96.5% | 98.4% | 103.2% | ||
| 1998 | 96 | 95.9% | 98.3% | 100.0% | ||
| 1999 | 50 | 94.4% | 97.4% | 100.5% | ||
| 2000 | 16 | 95.1% | 99.4% | 104.1% |
| Hover over boxplot or outliers for additional information |
| Chart generated 03/09/2018 |
| - Chromium, FIL, ICP-OES - |
| Lab: NWQL, PCode: 01030, MCode: PLA11 |
| Login Dates: 08/10/87 through 09/27/01 |
| Open Data Set |
| Boxplot Description |
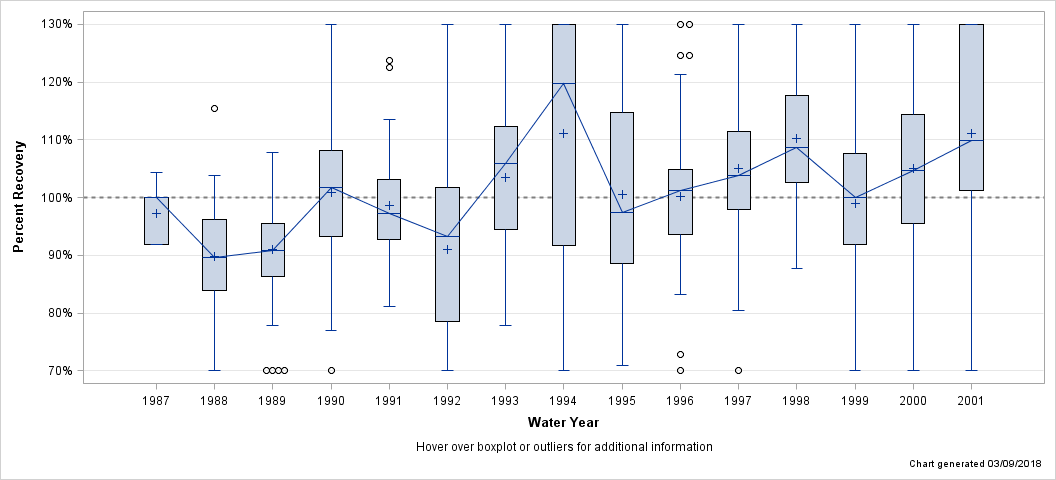
| Percent Recovery Statistics for Chromium, FIL, ICP-OES |
| Analyte | Parm-meth Code | Water Year | # of Samples |
25th Pctl | 50th Pctl (Median) |
75th Pctl |
|---|---|---|---|---|---|---|
| Chromium, FIL, ICP-OES | 01030PLA11 | 1987 | 20 | 92.0% | 100.0% | 100.0% |
| 1988 | 105 | 84.0% | 89.6% | 96.2% | ||
| 1989 | 62 | 86.4% | 90.9% | 95.5% | ||
| 1990 | 94 | 93.2% | 101.7% | 108.1% | ||
| 1991 | 156 | 92.8% | 97.3% | 103.1% | ||
| 1992 | 133 | 78.5% | 93.2% | 101.7% | ||
| 1993 | 132 | 94.4% | 106.0% | 112.4% | ||
| 1994 | 134 | 91.7% | 119.8% | 174.2% | ||
| 1995 | 135 | 88.5% | 97.4% | 114.7% | ||
| 1996 | 96 | 93.5% | 101.2% | 104.8% | ||
| 1997 | 96 | 98.0% | 103.8% | 111.4% | ||
| 1998 | 58 | 102.7% | 108.6% | 117.7% | ||
| 1999 | 69 | 91.8% | 100.0% | 107.6% | ||
| 2000 | 36 | 95.6% | 104.7% | 114.4% | ||
| 2001 | 33 | 101.1% | 109.9% | 142.7% |
| Hover over boxplot or outliers for additional information |
| Chart generated 03/09/2018 |
| - Chromium, UNF, AA - |
| Lab: NWQL, PCode: 01034, MCode: AA048 |
| Login Dates: 10/14/86 through 03/08/88 |
| Open Data Set |
| Boxplot Description |
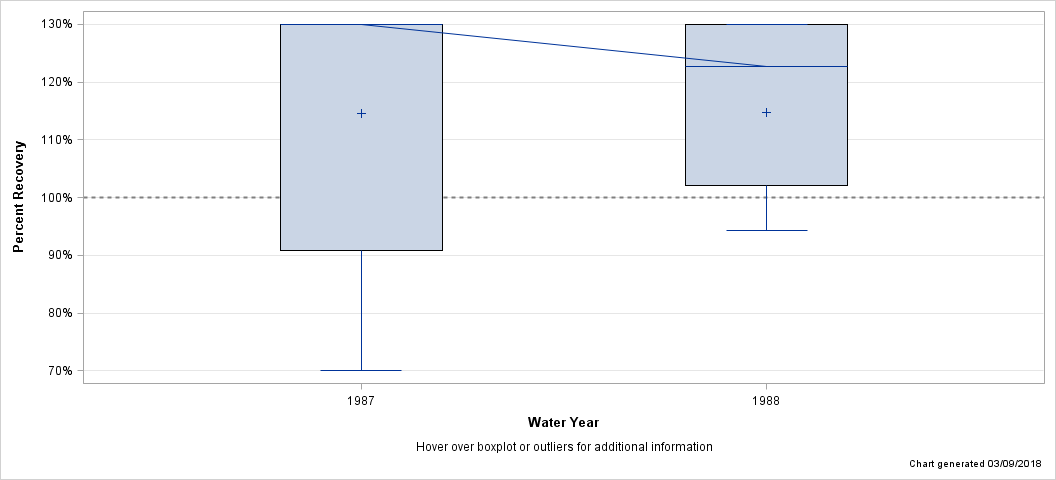
| Percent Recovery Statistics for Chromium, UNF, AA |
| Analyte | Parm-meth Code | Water Year | # of Samples |
25th Pctl | 50th Pctl (Median) |
75th Pctl |
|---|---|---|---|---|---|---|
| Chromium, UNF, AA | 01034AA048 | 1987 | 27 | 90.9% | 357.1% | 383.1% |
| 1988 | 7 | 102.0% | 122.7% | 152.2% |
| Hover over boxplot or outliers for additional information |
| Chart generated 03/09/2018 |
| - Chromium, UNF, DCP - |
| Lab: NWQL, PCode: 01034, MCode: DCP07 |
| Login Dates: 11/18/87 through 12/13/93 |
| Open Data Set |
| Boxplot Description |
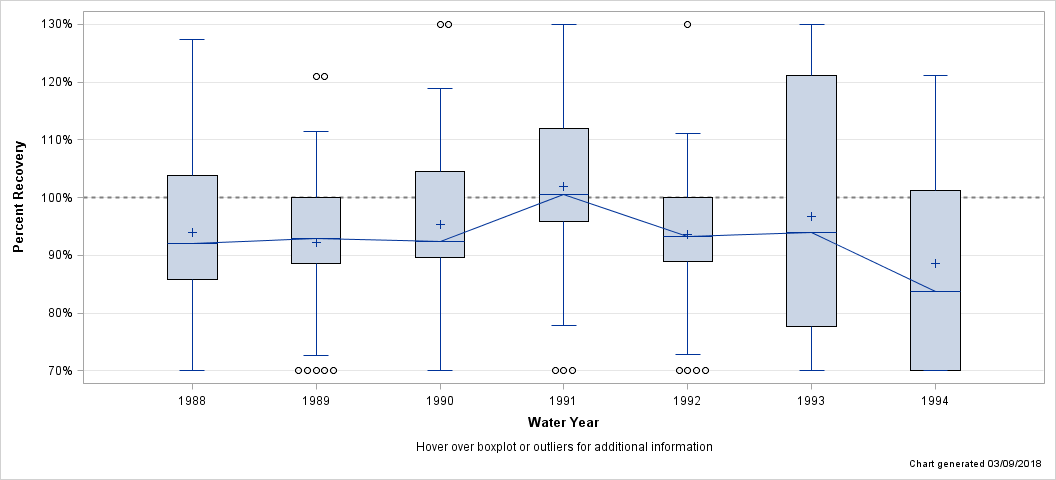
| Percent Recovery Statistics for Chromium, UNF, DCP |
| Analyte | Parm-meth Code | Water Year | # of Samples |
25th Pctl | 50th Pctl (Median) |
75th Pctl |
|---|---|---|---|---|---|---|
| Chromium, UNF, DCP | 01034DCP07 | 1988 | 41 | 85.9% | 92.0% | 103.8% |
| 1989 | 42 | 88.6% | 92.9% | 100.0% | ||
| 1990 | 67 | 89.6% | 92.3% | 104.5% | ||
| 1991 | 71 | 95.9% | 100.5% | 112.0% | ||
| 1992 | 67 | 88.9% | 93.3% | 100.0% | ||
| 1993 | 80 | 77.7% | 94.0% | 121.2% | ||
| 1994 | 12 | 53.5% | 83.7% | 101.2% |
| Hover over boxplot or outliers for additional information |
| Chart generated 03/09/2018 |
| - Chromium, UNF, GFAA - |
| Lab: NWQL, PCode: 01034, MCode: GF094 |
| Login Dates: 12/28/93 through 09/24/01 |
| Open Data Set |
| Boxplot Description |
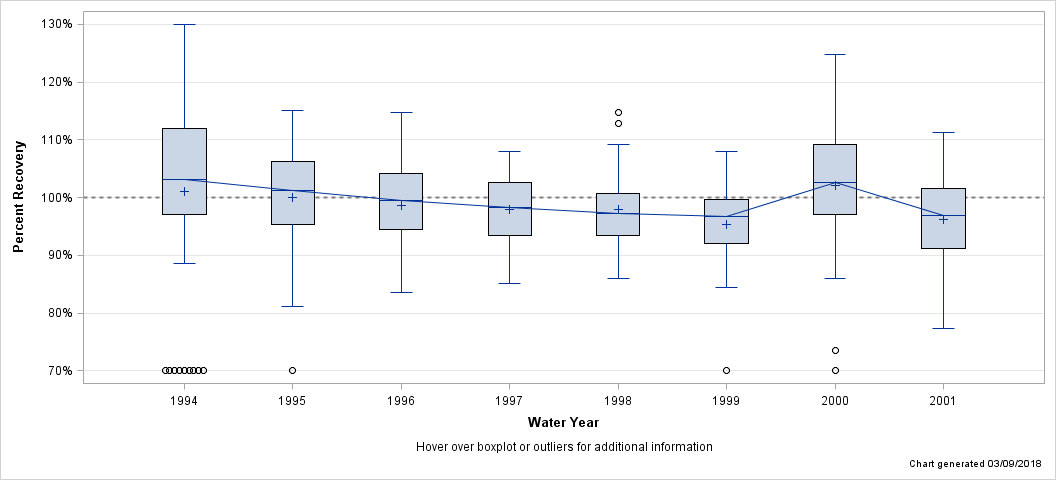
| Percent Recovery Statistics for Chromium, UNF, GFAA |
| Analyte | Parm-meth Code | Water Year | # of Samples |
25th Pctl | 50th Pctl (Median) |
75th Pctl |
|---|---|---|---|---|---|---|
| Chromium, UNF, GFAA | 01034GF094 | 1994 | 47 | 97.0% | 103.2% | 111.9% |
| 1995 | 60 | 95.3% | 101.2% | 106.2% | ||
| 1996 | 44 | 94.5% | 99.4% | 104.1% | ||
| 1997 | 45 | 93.5% | 98.3% | 102.6% | ||
| 1998 | 48 | 93.4% | 97.3% | 100.7% | ||
| 1999 | 48 | 92.1% | 96.8% | 99.7% | ||
| 2000 | 35 | 97.0% | 102.6% | 109.2% | ||
| 2001 | 35 | 91.1% | 97.0% | 101.5% |
| Hover over boxplot or outliers for additional information |
| Chart generated 03/09/2018 |
| - Cobalt, FIL - |
| Lab: NWQL, PCode: 01035, MCode: CX005 |
| Login Dates: 11/12/86 through 05/08/89 |
| Open Data Set |
| Boxplot Description |
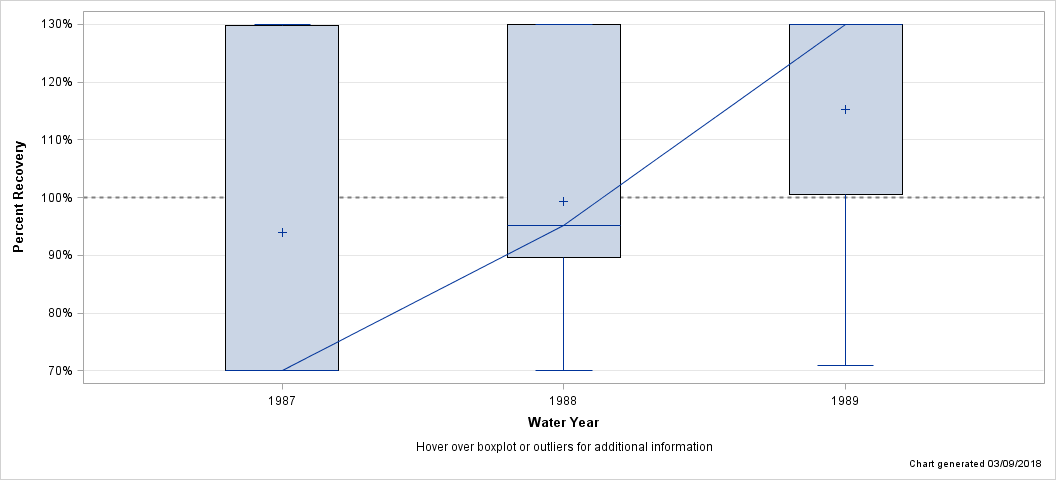
| Percent Recovery Statistics for Cobalt, FIL |
| Analyte | Parm-meth Code | Water Year | # of Samples |
25th Pctl | 50th Pctl (Median) |
75th Pctl |
|---|---|---|---|---|---|---|
| Cobalt, FIL | 01035CX005 | 1987 | 15 | 37.0% | 64.9% | 129.9% |
| 1988 | 22 | 89.6% | 95.2% | 138.9% | ||
| 1989 | 4 | 107.6% | 216.5% | 288.6% |
| Hover over boxplot or outliers for additional information |
| Chart generated 03/09/2018 |
| - Cobalt, FIL, GFAA - |
| Lab: NWQL, PCode: 01035, MCode: GF087 |
| Login Dates: 05/16/89 through 09/24/98 |
| Open Data Set |
| Boxplot Description |
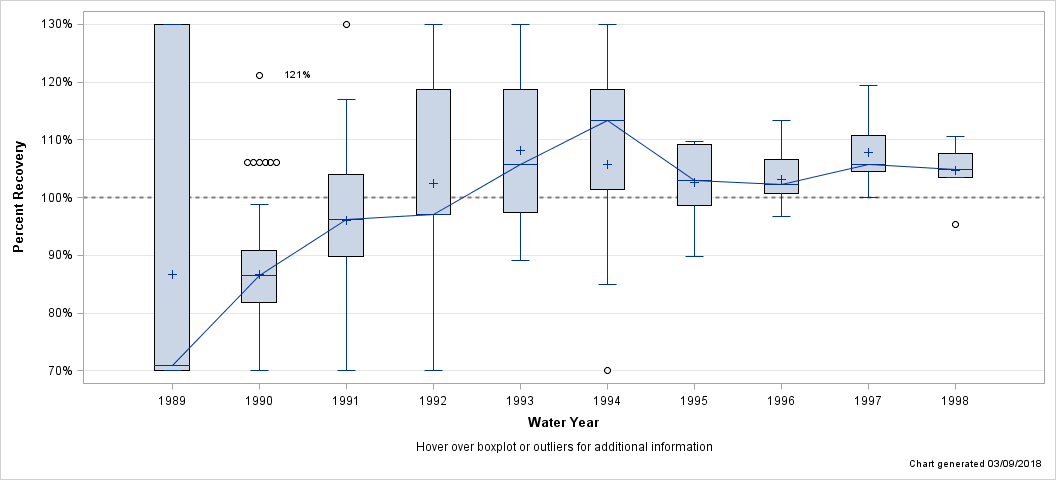
| Percent Recovery Statistics for Cobalt, FIL, GFAA |
| Analyte | Parm-meth Code | Water Year | # of Samples |
25th Pctl | 50th Pctl (Median) |
75th Pctl |
|---|---|---|---|---|---|---|
| Cobalt, FIL, GFAA | 01035GF087 | 1989 | 11 | 69.6% | 70.9% | 144.3% |
| 1990 | 113 | 81.9% | 86.4% | 90.9% | ||
| 1991 | 42 | 89.7% | 96.2% | 104.0% | ||
| 1992 | 48 | 97.1% | 97.1% | 118.7% | ||
| 1993 | 48 | 97.4% | 105.7% | 118.7% | ||
| 1994 | 25 | 101.4% | 113.3% | 118.7% | ||
| 1995 | 36 | 98.7% | 103.0% | 109.2% | ||
| 1996 | 23 | 100.7% | 102.2% | 106.7% | ||
| 1997 | 21 | 104.5% | 105.8% | 110.8% | ||
| 1998 | 8 | 103.5% | 104.9% | 107.6% |
| Hover over boxplot or outliers for additional information |
| Chart generated 03/09/2018 |
| - Cobalt, FIL, GFAA, LL - |
| Lab: NWQL, PCode: 01035, MCode: AA015 |
| Login Dates: 03/06/87 through 09/30/92 |
| Open Data Set |
| Boxplot Description |
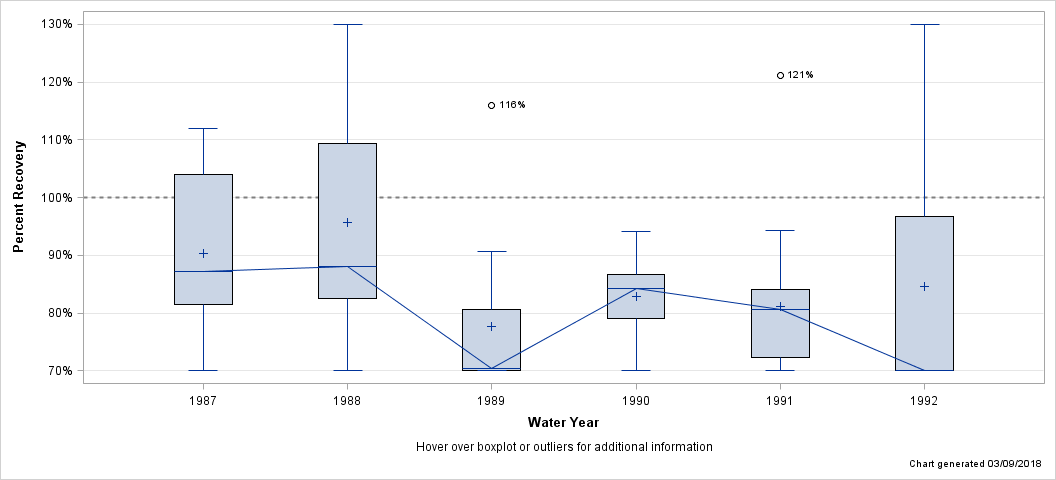
| Percent Recovery Statistics for Cobalt, FIL, GFAA, LL |
| Analyte | Parm-meth Code | Water Year | # of Samples |
25th Pctl | 50th Pctl (Median) |
75th Pctl |
|---|---|---|---|---|---|---|
| Cobalt, FIL, GFAA, LL | 01035AA015 | 1987 | 6 | 81.4% | 87.2% | 104.0% |
| 1988 | 9 | 82.5% | 88.0% | 109.3% | ||
| 1989 | 13 | 63.3% | 70.5% | 80.5% | ||
| 1990 | 13 | 79.0% | 84.2% | 86.7% | ||
| 1991 | 21 | 72.3% | 80.7% | 84.0% | ||
| 1992 | 24 | 61.5% | 69.2% | 96.8% |
| Hover over boxplot or outliers for additional information |
| Chart generated 03/09/2018 |
| - Cobalt, FIL, ICP-MS - |
| Lab: NWQL, PCode: 01035, MCode: PLM43 |
| Login Dates: 02/07/94 through 09/27/01 |
| Open Data Set |
| Boxplot Description |
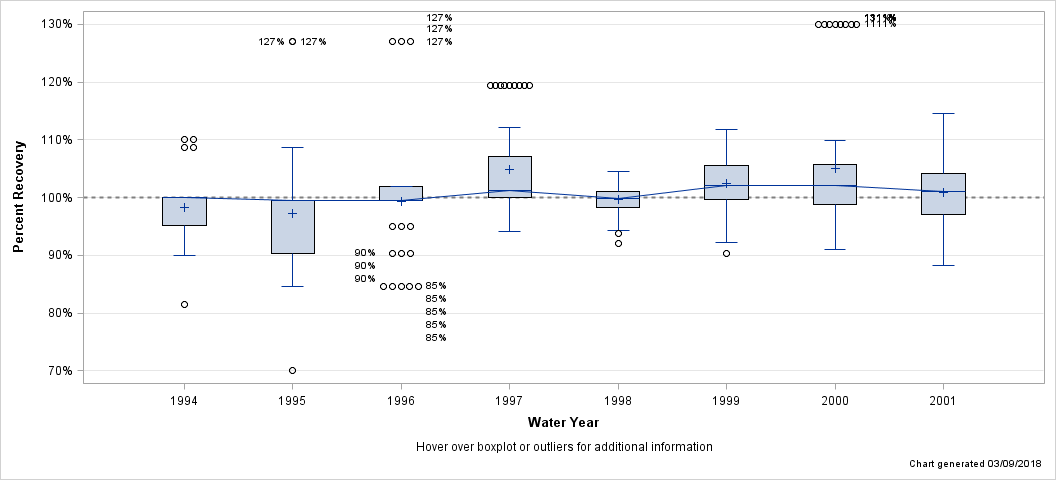
| Percent Recovery Statistics for Cobalt, FIL, ICP-MS |
| Analyte | Parm-meth Code | Water Year | # of Samples |
25th Pctl | 50th Pctl (Median) |
75th Pctl |
|---|---|---|---|---|---|---|
| Cobalt, FIL, ICP-MS | 01035PLM43 | 1994 | 32 | 95.1% | 100.0% | 100.0% |
| 1995 | 47 | 90.4% | 99.4% | 99.4% | ||
| 1996 | 46 | 99.4% | 99.4% | 101.9% | ||
| 1997 | 48 | 100.0% | 101.2% | 107.1% | ||
| 1998 | 64 | 98.3% | 99.8% | 101.1% | ||
| 1999 | 82 | 99.7% | 102.1% | 105.6% | ||
| 2000 | 60 | 98.7% | 102.1% | 105.7% | ||
| 2001 | 71 | 97.1% | 101.0% | 104.1% |
| Hover over boxplot or outliers for additional information |
| Chart generated 03/09/2018 |
| - Cobalt, FIL, ICP-OES - |
| Lab: NWQL, PCode: 01035, MCode: PLA11 |
| Login Dates: 10/14/86 through 09/27/01 |
| Open Data Set |
| Boxplot Description |
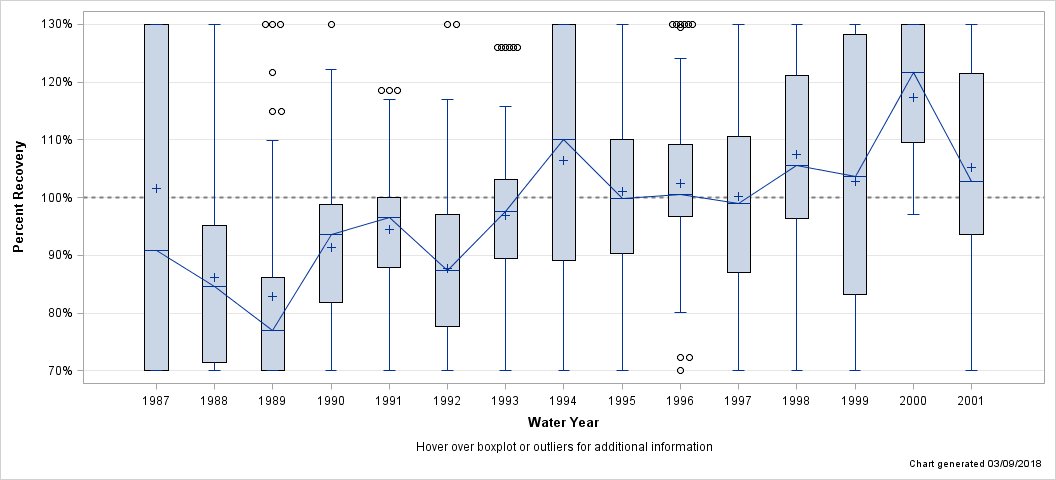
| Percent Recovery Statistics for Cobalt, FIL, ICP-OES |
| Analyte | Parm-meth Code | Water Year | # of Samples |
25th Pctl | 50th Pctl (Median) |
75th Pctl |
|---|---|---|---|---|---|---|
| Cobalt, FIL, ICP-OES | 01035PLA11 | 1987 | 162 | 68.2% | 90.9% | 187.5% |
| 1988 | 186 | 71.4% | 84.5% | 95.2% | ||
| 1989 | 123 | 69.6% | 76.9% | 86.2% | ||
| 1990 | 129 | 81.9% | 93.5% | 98.8% | ||
| 1991 | 191 | 87.8% | 96.5% | 100.0% | ||
| 1992 | 133 | 77.7% | 87.4% | 97.1% | ||
| 1993 | 132 | 89.4% | 97.6% | 103.1% | ||
| 1994 | 134 | 89.0% | 110.0% | 130.0% | ||
| 1995 | 135 | 90.4% | 99.9% | 110.1% | ||
| 1996 | 96 | 96.7% | 100.6% | 109.2% | ||
| 1997 | 96 | 87.0% | 99.0% | 110.6% | ||
| 1998 | 28 | 96.4% | 105.5% | 121.2% | ||
| 1999 | 36 | 83.2% | 103.6% | 128.3% | ||
| 2000 | 14 | 109.5% | 121.7% | 130.4% | ||
| 2001 | 28 | 93.6% | 102.8% | 121.5% |
| Hover over boxplot or outliers for additional information |
| Chart generated 03/09/2018 |
| - Cobalt, UNF, AA - |
| Lab: NWQL, PCode: 01037, MCode: CX015 |
| Login Dates: 10/14/86 through 04/27/89 |
| Open Data Set |
| Boxplot Description |
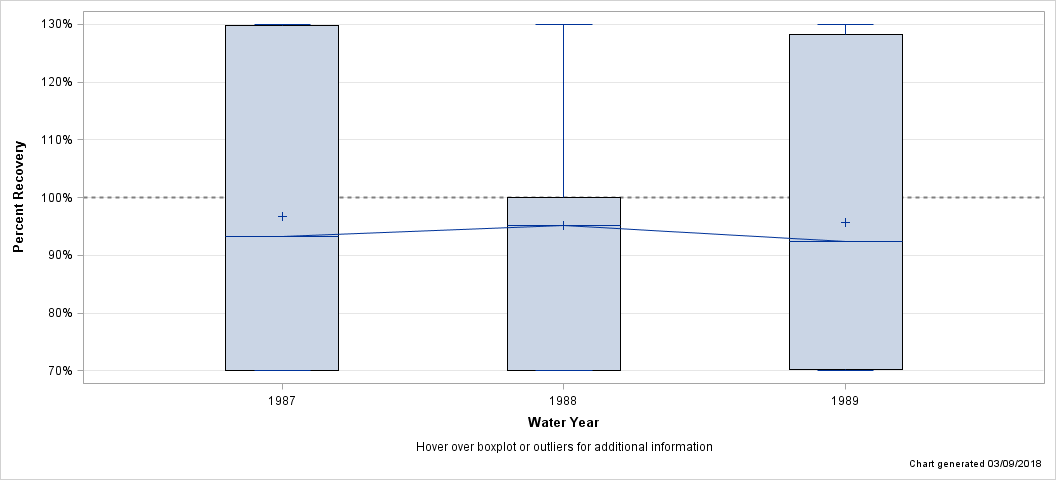
| Percent Recovery Statistics for Cobalt, UNF, AA |
| Analyte | Parm-meth Code | Water Year | # of Samples |
25th Pctl | 50th Pctl (Median) |
75th Pctl |
|---|---|---|---|---|---|---|
| Cobalt, UNF, AA | 01037CX015 | 1987 | 27 | 64.9% | 93.3% | 129.9% |
| 1988 | 46 | 59.7% | 95.2% | 100.0% | ||
| 1989 | 20 | 70.2% | 92.4% | 128.2% |
| Hover over boxplot or outliers for additional information |
| Chart generated 03/09/2018 |
| - Cobalt, UNF, GFAA - |
| Lab: NWQL, PCode: 01037, MCode: GF098 |
| Login Dates: 05/08/89 through 09/14/01 |
| Open Data Set |
| Boxplot Description |
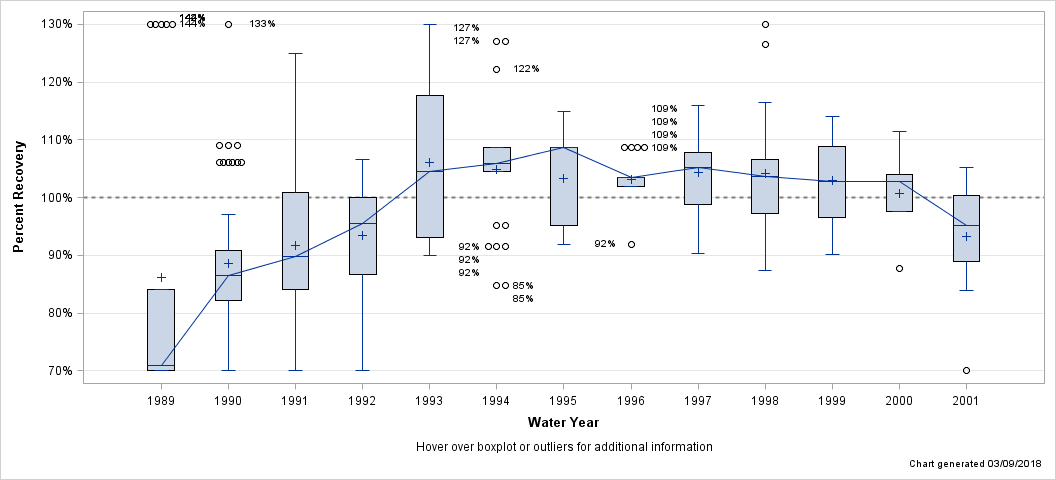
| Percent Recovery Statistics for Cobalt, UNF, GFAA |
| Analyte | Parm-meth Code | Water Year | # of Samples |
25th Pctl | 50th Pctl (Median) |
75th Pctl |
|---|---|---|---|---|---|---|
| Cobalt, UNF, GFAA | 01037GF098 | 1989 | 22 | 69.6% | 70.9% | 84.0% |
| 1990 | 68 | 82.1% | 86.4% | 90.9% | ||
| 1991 | 37 | 84.0% | 89.7% | 100.8% | ||
| 1992 | 34 | 86.7% | 95.6% | 100.0% | ||
| 1993 | 34 | 93.0% | 104.6% | 117.6% | ||
| 1994 | 36 | 104.6% | 105.9% | 108.7% | ||
| 1995 | 24 | 95.1% | 108.7% | 108.7% | ||
| 1996 | 21 | 101.9% | 103.4% | 103.4% | ||
| 1997 | 24 | 98.8% | 105.3% | 107.8% | ||
| 1998 | 24 | 97.2% | 103.7% | 106.6% | ||
| 1999 | 16 | 96.6% | 102.8% | 108.8% | ||
| 2000 | 7 | 97.6% | 102.8% | 103.9% | ||
| 2001 | 12 | 89.0% | 95.2% | 100.4% |
| Hover over boxplot or outliers for additional information |
| Chart generated 03/09/2018 |
| - Copper, FIL, AA - |
| Lab: NWQL, PCode: 01040, MCode: AA016 |
| Login Dates: 10/14/86 through 11/05/86 |
| Open Data Set |
| Boxplot Description |
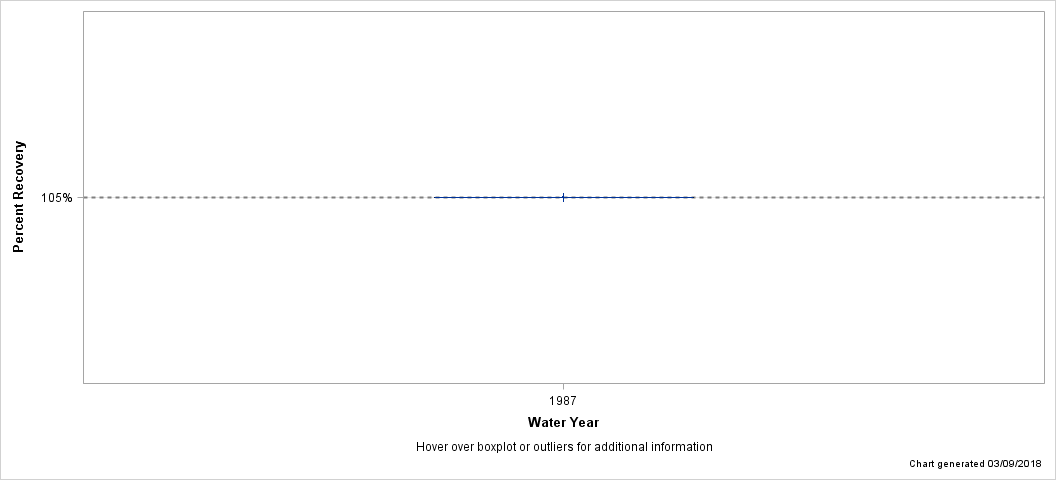
| Percent Recovery Statistics for Copper, FIL, AA |
| Analyte | Parm-meth Code | Water Year | # of Samples |
25th Pctl | 50th Pctl (Median) |
75th Pctl |
|---|---|---|---|---|---|---|
| Copper, FIL, AA | 01040AA016 | 1987 | 4 | 104.6% | 104.6% | 104.6% |
| Hover over boxplot or outliers for additional information |
| Chart generated 03/09/2018 |
| - Copper, FIL, AA - |
| Lab: NWQL, PCode: 01040, MCode: CX006 |
| Login Dates: 10/15/86 through 05/08/89 |
| Open Data Set |
| Boxplot Description |
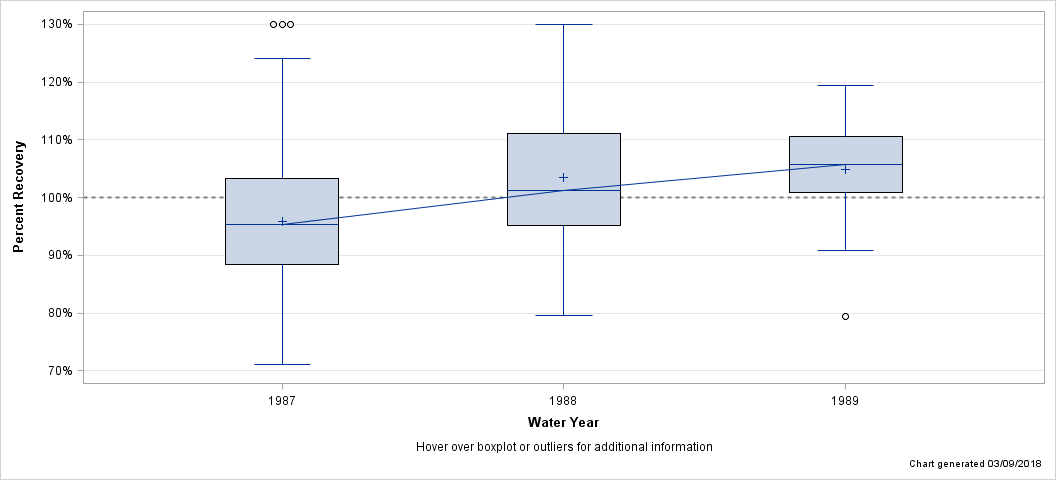
| Percent Recovery Statistics for Copper, FIL, AA |
| Analyte | Parm-meth Code | Water Year | # of Samples |
25th Pctl | 50th Pctl (Median) |
75th Pctl |
|---|---|---|---|---|---|---|
| Copper, FIL, AA | 01040CX006 | 1987 | 30 | 88.4% | 95.3% | 103.3% |
| 1988 | 86 | 95.2% | 101.2% | 111.1% | ||
| 1989 | 25 | 101.0% | 105.8% | 110.6% |
| Hover over boxplot or outliers for additional information |
| Chart generated 03/09/2018 |
| - Copper, FIL, GFAA - |
| Lab: NWQL, PCode: 01040, MCode: GF088 |
| Login Dates: 05/15/89 through 09/24/01 |
| Open Data Set |
| Boxplot Description |
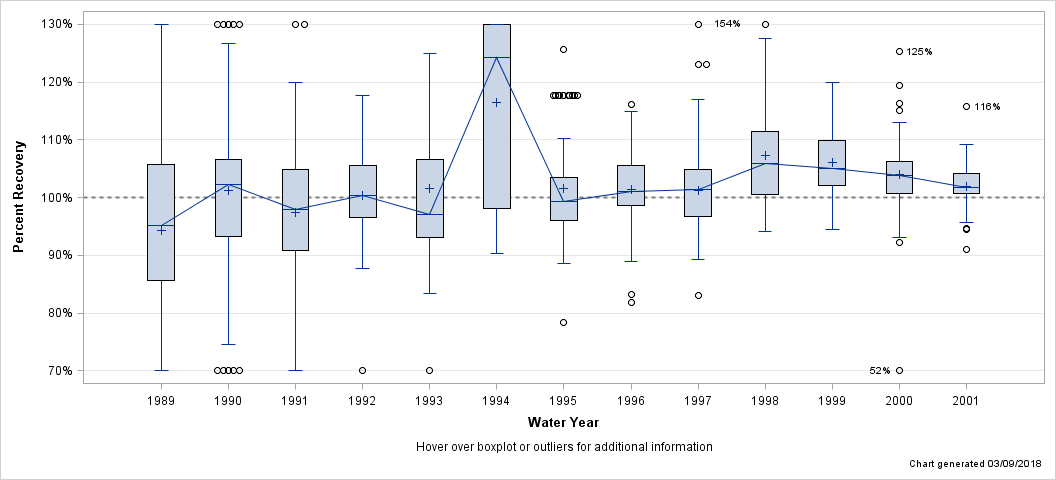
| Percent Recovery Statistics for Copper, FIL, GFAA |
| Analyte | Parm-meth Code | Water Year | # of Samples |
25th Pctl | 50th Pctl (Median) |
75th Pctl |
|---|---|---|---|---|---|---|
| Copper, FIL, GFAA | 01040GF088 | 1989 | 48 | 85.6% | 95.2% | 105.8% |
| 1990 | 181 | 93.3% | 102.3% | 106.7% | ||
| 1991 | 86 | 90.9% | 97.9% | 104.9% | ||
| 1992 | 142 | 96.5% | 100.4% | 105.6% | ||
| 1993 | 141 | 93.2% | 97.0% | 106.7% | ||
| 1994 | 121 | 98.0% | 124.2% | 138.9% | ||
| 1995 | 110 | 96.1% | 99.3% | 103.4% | ||
| 1996 | 87 | 98.7% | 101.1% | 105.5% | ||
| 1997 | 92 | 96.8% | 101.3% | 104.9% | ||
| 1998 | 37 | 100.5% | 105.8% | 111.4% | ||
| 1999 | 48 | 102.1% | 105.1% | 109.9% | ||
| 2000 | 48 | 100.7% | 103.9% | 106.3% | ||
| 2001 | 47 | 100.6% | 101.8% | 104.1% |
| Hover over boxplot or outliers for additional information |
| Chart generated 03/09/2018 |
| - Copper, FIL, GFAA, LL - |
| Lab: NWQL, PCode: 01040, MCode: GF077 |
| Login Dates: 03/06/87 through 09/27/94 |
| Open Data Set |
| Boxplot Description |
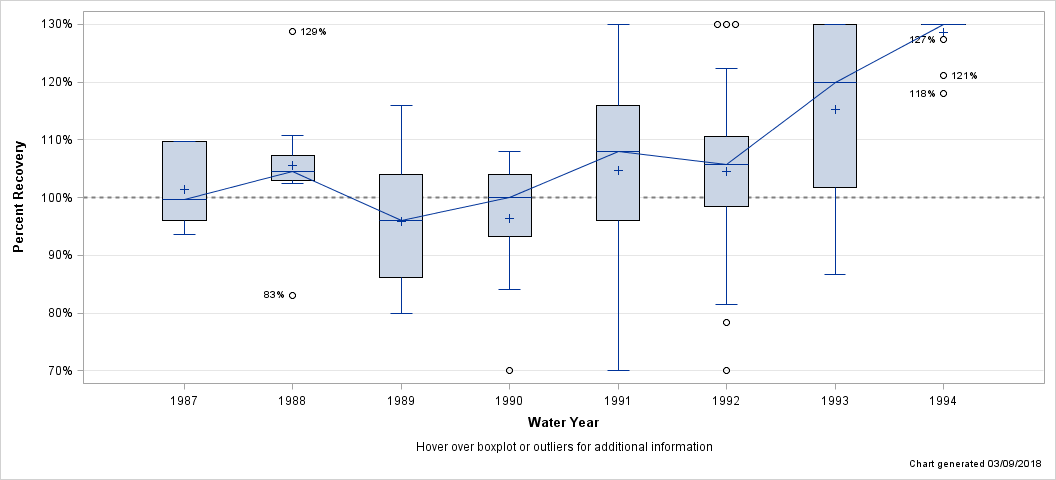
| Percent Recovery Statistics for Copper, FIL, GFAA, LL |
| Analyte | Parm-meth Code | Water Year | # of Samples |
25th Pctl | 50th Pctl (Median) |
75th Pctl |
|---|---|---|---|---|---|---|
| Copper, FIL, GFAA, LL | 01040GF077 | 1987 | 6 | 96.1% | 99.8% | 109.7% |
| 1988 | 9 | 103.0% | 104.6% | 107.3% | ||
| 1989 | 13 | 86.1% | 96.0% | 104.0% | ||
| 1990 | 13 | 93.3% | 100.0% | 104.0% | ||
| 1991 | 21 | 96.0% | 108.0% | 116.0% | ||
| 1992 | 24 | 98.5% | 105.7% | 110.6% | ||
| 1993 | 24 | 101.7% | 120.0% | 135.0% | ||
| 1994 | 18 | 138.9% | 141.7% | 147.2% |
| Hover over boxplot or outliers for additional information |
| Chart generated 03/09/2018 |
| - Copper, FIL, ICP-MS - |
| Lab: NWQL, PCode: 01040, MCode: PLM43 |
| Login Dates: 02/07/94 through 09/27/01 |
| Open Data Set |
| Boxplot Description |
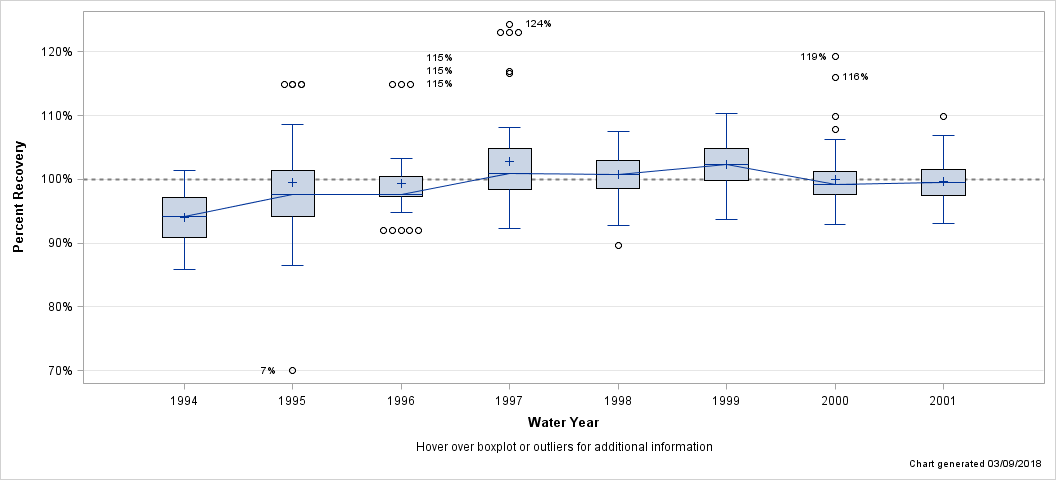
| Percent Recovery Statistics for Copper, FIL, ICP-MS |
| Analyte | Parm-meth Code | Water Year | # of Samples |
25th Pctl | 50th Pctl (Median) |
75th Pctl |
|---|---|---|---|---|---|---|
| Copper, FIL, ICP-MS | 01040PLM43 | 1994 | 32 | 90.9% | 94.2% | 97.2% |
| 1995 | 47 | 94.2% | 97.6% | 101.4% | ||
| 1996 | 46 | 97.4% | 97.6% | 100.4% | ||
| 1997 | 48 | 98.5% | 100.9% | 104.8% | ||
| 1998 | 64 | 98.6% | 100.7% | 103.0% | ||
| 1999 | 96 | 99.8% | 102.3% | 104.8% | ||
| 2000 | 72 | 97.6% | 99.2% | 101.3% | ||
| 2001 | 71 | 97.5% | 99.5% | 101.5% |
| Hover over boxplot or outliers for additional information |
| Chart generated 03/09/2018 |
| - Copper, FIL, ICP-OES - |
| Lab: NWQL, PCode: 01040, MCode: PLA11 |
| Login Dates: 10/14/86 through 09/27/01 |
| Open Data Set |
| Boxplot Description |
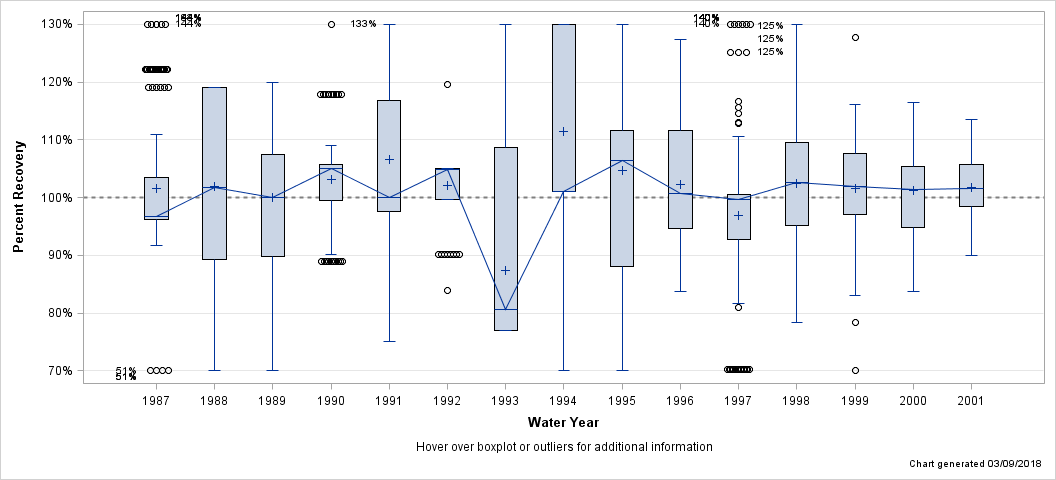
| Percent Recovery Statistics for Copper, FIL, ICP-OES |
| Analyte | Parm-meth Code | Water Year | # of Samples |
25th Pctl | 50th Pctl (Median) |
75th Pctl |
|---|---|---|---|---|---|---|
| Copper, FIL, ICP-OES | 01040PLA11 | 1987 | 162 | 96.2% | 96.8% | 103.4% |
| 1988 | 146 | 89.3% | 101.7% | 119.0% | ||
| 1989 | 123 | 89.8% | 100.0% | 107.5% | ||
| 1990 | 128 | 99.5% | 105.1% | 105.8% | ||
| 1991 | 171 | 97.6% | 100.0% | 116.8% | ||
| 1992 | 133 | 99.6% | 104.8% | 105.1% | ||
| 1993 | 132 | 76.9% | 80.6% | 108.7% | ||
| 1994 | 134 | 101.0% | 101.0% | 133.3% | ||
| 1995 | 135 | 88.1% | 106.4% | 111.6% | ||
| 1996 | 96 | 94.7% | 100.8% | 111.6% | ||
| 1997 | 96 | 92.8% | 99.6% | 100.5% | ||
| 1998 | 48 | 95.2% | 102.7% | 109.5% | ||
| 1999 | 69 | 97.0% | 101.8% | 107.7% | ||
| 2000 | 36 | 94.8% | 101.5% | 105.4% | ||
| 2001 | 37 | 98.5% | 101.6% | 105.7% |
| Hover over boxplot or outliers for additional information |
| Chart generated 03/09/2018 |
| - Copper, UNF - |
| Lab: NWQL, PCode: 01042, MCode: CX016 |
| Login Dates: 10/14/86 through 04/27/89 |
| Open Data Set |
| Boxplot Description |
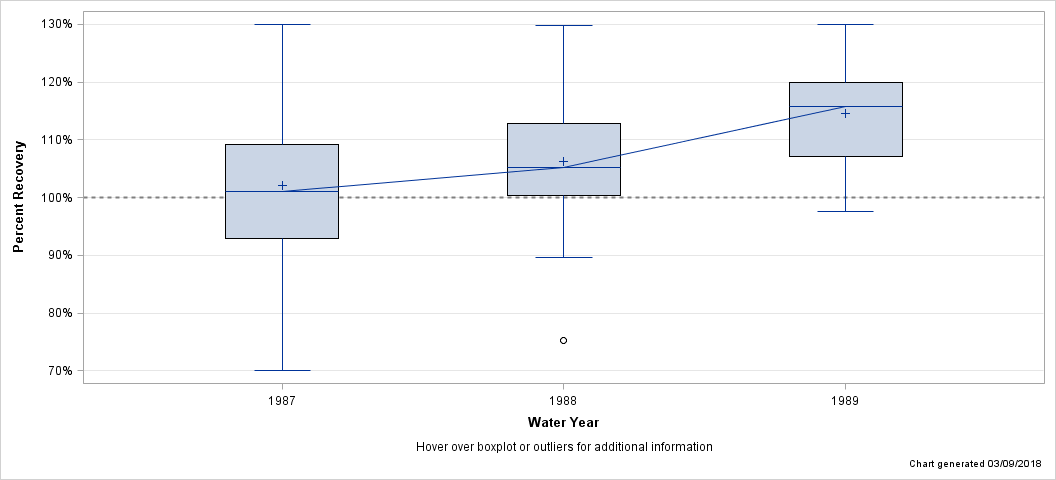
| Percent Recovery Statistics for Copper, UNF |
| Analyte | Parm-meth Code | Water Year | # of Samples |
25th Pctl | 50th Pctl (Median) |
75th Pctl |
|---|---|---|---|---|---|---|
| Copper, UNF | 01042CX016 | 1987 | 24 | 93.0% | 101.1% | 109.1% |
| 1988 | 46 | 100.4% | 105.2% | 112.9% | ||
| 1989 | 12 | 107.2% | 115.7% | 120.0% |
| Hover over boxplot or outliers for additional information |
| Chart generated 03/09/2018 |
| - Copper, UNF, GFAA - |
| Lab: NWQL, PCode: 01042, MCode: GF099 |
| Login Dates: 05/08/89 through 09/28/01 |
| Open Data Set |
| Boxplot Description |
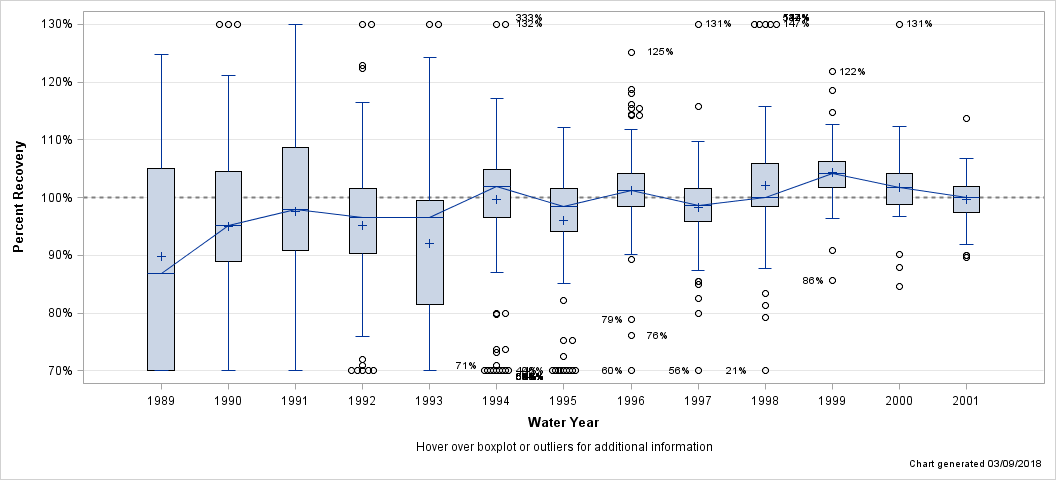
| Percent Recovery Statistics for Copper, UNF, GFAA |
| Analyte | Parm-meth Code | Water Year | # of Samples |
25th Pctl | 50th Pctl (Median) |
75th Pctl |
|---|---|---|---|---|---|---|
| Copper, UNF, GFAA | 01042GF099 | 1989 | 22 | 68.0% | 86.9% | 105.1% |
| 1990 | 65 | 88.9% | 95.2% | 104.5% | ||
| 1991 | 72 | 90.9% | 97.9% | 108.7% | ||
| 1992 | 70 | 90.3% | 96.5% | 101.6% | ||
| 1993 | 80 | 81.4% | 96.5% | 99.6% | ||
| 1994 | 120 | 96.5% | 102.0% | 104.8% | ||
| 1995 | 119 | 94.2% | 98.4% | 101.6% | ||
| 1996 | 102 | 98.4% | 101.3% | 104.1% | ||
| 1997 | 93 | 95.8% | 98.7% | 101.6% | ||
| 1998 | 53 | 98.4% | 100.0% | 105.8% | ||
| 1999 | 51 | 101.8% | 104.1% | 106.3% | ||
| 2000 | 51 | 98.8% | 101.7% | 104.2% | ||
| 2001 | 47 | 97.4% | 100.1% | 102.0% |
| Hover over boxplot or outliers for additional information |
| Chart generated 03/09/2018 |
| - Copper, UNF, ICP-OES - |
| Lab: NWQL, PCode: 01042, MCode: PLA15 |
| Login Dates: 04/12/99 through 09/14/01 |
| Open Data Set |
| Boxplot Description |
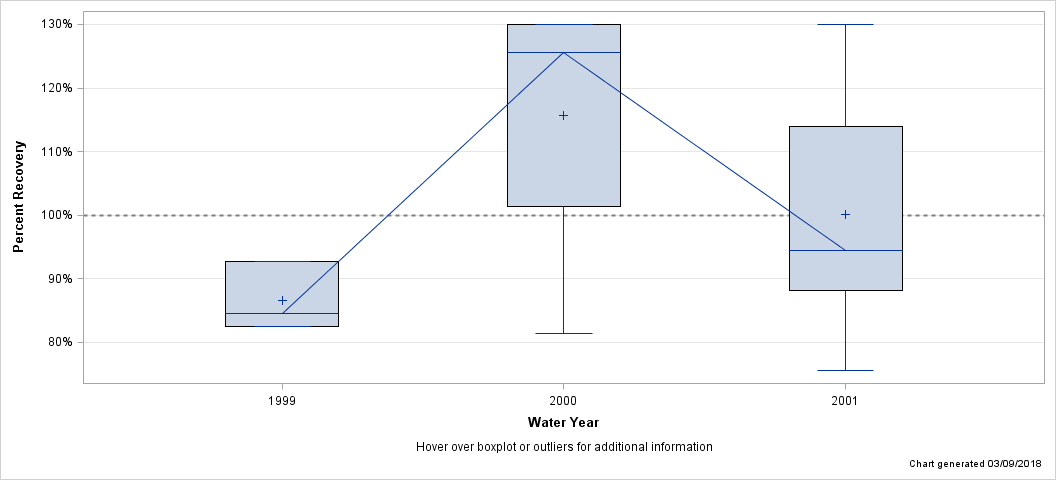
| Percent Recovery Statistics for Copper, UNF, ICP-OES |
| Analyte | Parm-meth Code | Water Year | # of Samples |
25th Pctl | 50th Pctl (Median) |
75th Pctl |
|---|---|---|---|---|---|---|
| Copper, UNF, ICP-OES | 01042PLA15 | 1999 | 3 | 82.5% | 84.5% | 92.6% |
| 2000 | 4 | 101.3% | 128.6% | 143.6% | ||
| 2001 | 10 | 88.2% | 94.5% | 113.9% |
| Hover over boxplot or outliers for additional information |
| Chart generated 03/09/2018 |
| - Iron, FIL, AA - |
| Lab: NWQL, PCode: 01046, MCode: AA018 |
| Login Dates: 10/14/86 through 03/29/96 |
| Open Data Set |
| Boxplot Description |
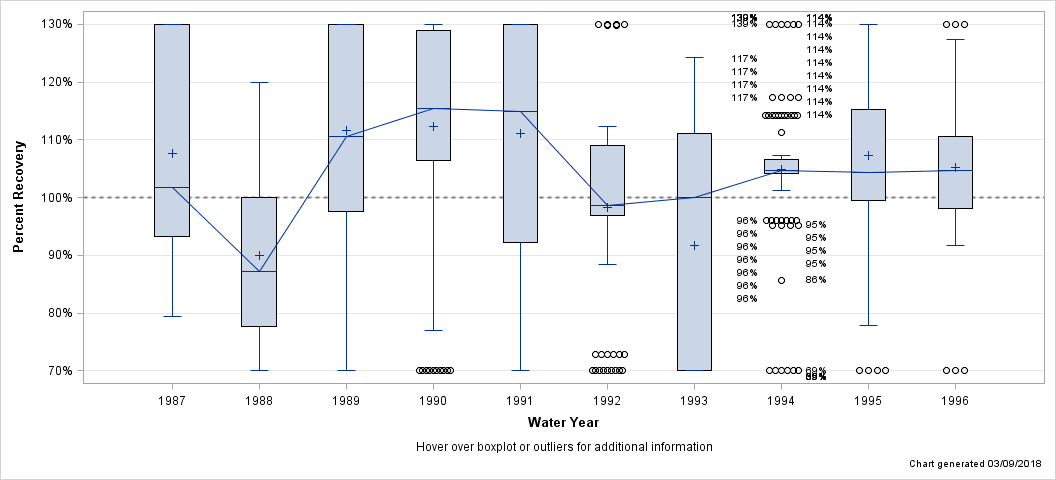
| Percent Recovery Statistics for Iron, FIL, AA |
| Analyte | Parm-meth Code | Water Year | # of Samples |
25th Pctl | 50th Pctl (Median) |
75th Pctl |
|---|---|---|---|---|---|---|
| Iron, FIL, AA | 01046AA018 | 1987 | 34 | 93.2% | 101.8% | 387.1% |
| 1988 | 45 | 77.7% | 87.1% | 100.0% | ||
| 1989 | 74 | 97.6% | 110.6% | 134.3% | ||
| 1990 | 175 | 106.4% | 115.4% | 129.0% | ||
| 1991 | 60 | 92.3% | 114.9% | 143.7% | ||
| 1992 | 110 | 96.9% | 98.6% | 109.1% | ||
| 1993 | 96 | 62.1% | 100.0% | 111.1% | ||
| 1994 | 99 | 104.2% | 104.8% | 106.6% | ||
| 1995 | 109 | 99.5% | 104.3% | 115.2% | ||
| 1996 | 43 | 98.2% | 104.7% | 110.6% |
| Hover over boxplot or outliers for additional information |
| Chart generated 03/09/2018 |
| - Iron, FIL, ICP-OES - |
| Lab: NWQL, PCode: 01046, MCode: PLA11 |
| Login Dates: 10/14/86 through 09/27/01 |
| Open Data Set |
| Boxplot Description |
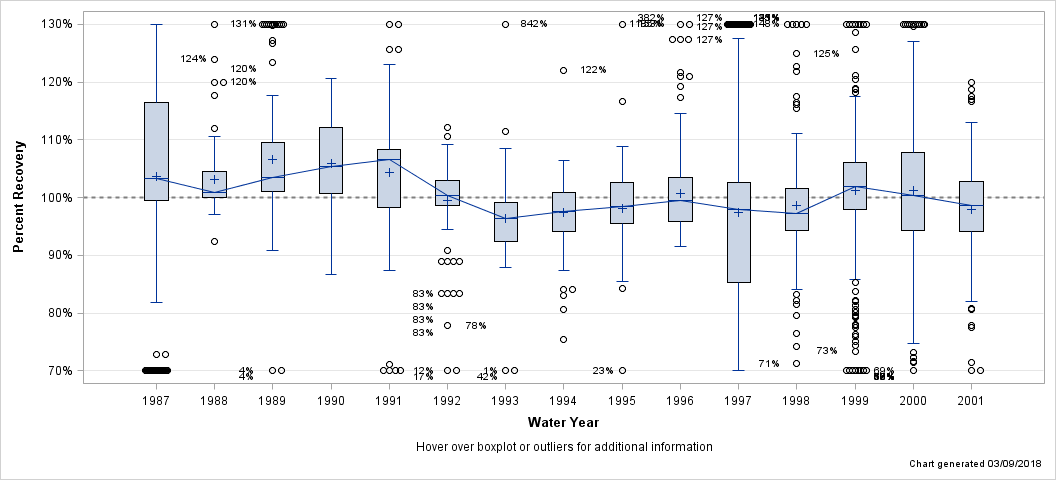
| Percent Recovery Statistics for Iron, FIL, ICP-OES |
| Analyte | Parm-meth Code | Water Year | # of Samples |
25th Pctl | 50th Pctl (Median) |
75th Pctl |
|---|---|---|---|---|---|---|
| Iron, FIL, ICP-OES | 01046PLA11 | 1987 | 162 | 99.4% | 103.3% | 116.4% |
| 1988 | 186 | 100.0% | 100.8% | 104.5% | ||
| 1989 | 123 | 101.1% | 103.5% | 109.6% | ||
| 1990 | 130 | 100.7% | 105.4% | 112.1% | ||
| 1991 | 128 | 98.4% | 106.6% | 108.3% | ||
| 1992 | 213 | 98.7% | 100.3% | 102.9% | ||
| 1993 | 223 | 92.4% | 96.4% | 99.1% | ||
| 1994 | 202 | 94.1% | 97.7% | 100.8% | ||
| 1995 | 230 | 95.4% | 98.5% | 102.6% | ||
| 1996 | 227 | 95.8% | 99.4% | 103.4% | ||
| 1997 | 236 | 85.2% | 97.9% | 102.6% | ||
| 1998 | 190 | 94.2% | 97.2% | 101.5% | ||
| 1999 | 210 | 97.9% | 102.0% | 106.0% | ||
| 2000 | 220 | 94.3% | 100.4% | 107.8% | ||
| 2001 | 236 | 94.0% | 98.7% | 102.8% |
| Hover over boxplot or outliers for additional information |
| Chart generated 03/09/2018 |
| - Iron, FIL, ICP-OES, LL - |
| Lab: NWQL, PCode: 01046, MCode: PLA09 |
| Login Dates: 10/08/92 through 09/27/94 |
| Open Data Set |
| Boxplot Description |
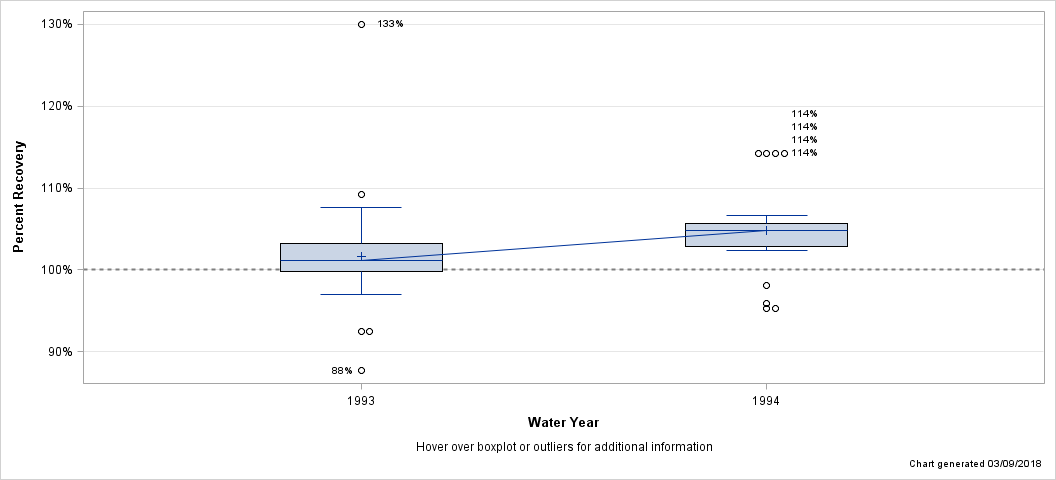
| Percent Recovery Statistics for Iron, FIL, ICP-OES, LL |
| Analyte | Parm-meth Code | Water Year | # of Samples |
25th Pctl | 50th Pctl (Median) |
75th Pctl |
|---|---|---|---|---|---|---|
| Iron, FIL, ICP-OES, LL | 01046PLA09 | 1993 | 24 | 99.8% | 101.1% | 103.2% |
| 1994 | 24 | 102.9% | 104.8% | 105.7% |
| Hover over boxplot or outliers for additional information |
| Chart generated 03/09/2018 |
| - Iron, UNF, AA - |
| Lab: NWQL, PCode: 01045, MCode: AA054 |
| Login Dates: 10/14/86 through 03/15/99 |
| Open Data Set |
| Boxplot Description |
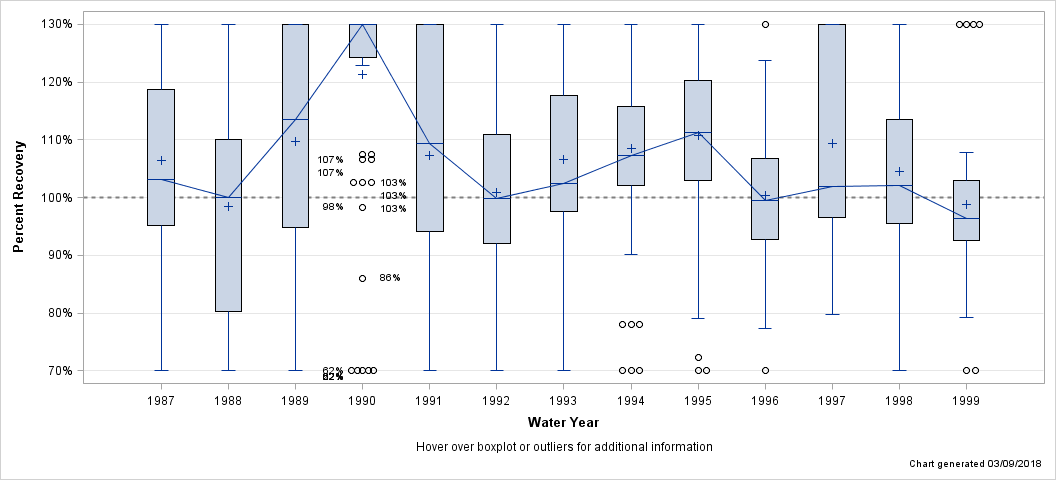
| Percent Recovery Statistics for Iron, UNF, AA |
| Analyte | Parm-meth Code | Water Year | # of Samples |
25th Pctl | 50th Pctl (Median) |
75th Pctl |
|---|---|---|---|---|---|---|
| Iron, UNF, AA | 01045AA054 | 1987 | 24 | 95.2% | 103.2% | 118.8% |
| 1988 | 46 | 80.3% | 100.0% | 110.0% | ||
| 1989 | 42 | 94.8% | 113.5% | 132.7% | ||
| 1990 | 68 | 124.2% | 189.9% | 381.7% | ||
| 1991 | 47 | 94.0% | 109.3% | 138.9% | ||
| 1992 | 82 | 92.1% | 99.9% | 111.0% | ||
| 1993 | 80 | 97.6% | 102.4% | 117.7% | ||
| 1994 | 120 | 102.0% | 107.3% | 115.8% | ||
| 1995 | 120 | 102.9% | 111.4% | 120.4% | ||
| 1996 | 102 | 92.8% | 99.4% | 106.7% | ||
| 1997 | 93 | 96.5% | 101.9% | 169.5% | ||
| 1998 | 72 | 95.5% | 102.1% | 113.5% | ||
| 1999 | 26 | 92.5% | 96.4% | 103.0% |
| Hover over boxplot or outliers for additional information |
| Chart generated 03/09/2018 |
| - Iron, UNF, ICP-OES - |
| Lab: NWQL, PCode: 01045, MCode: PLA15 |
| Login Dates: 04/05/99 through 09/28/01 |
| Open Data Set |
| Boxplot Description |
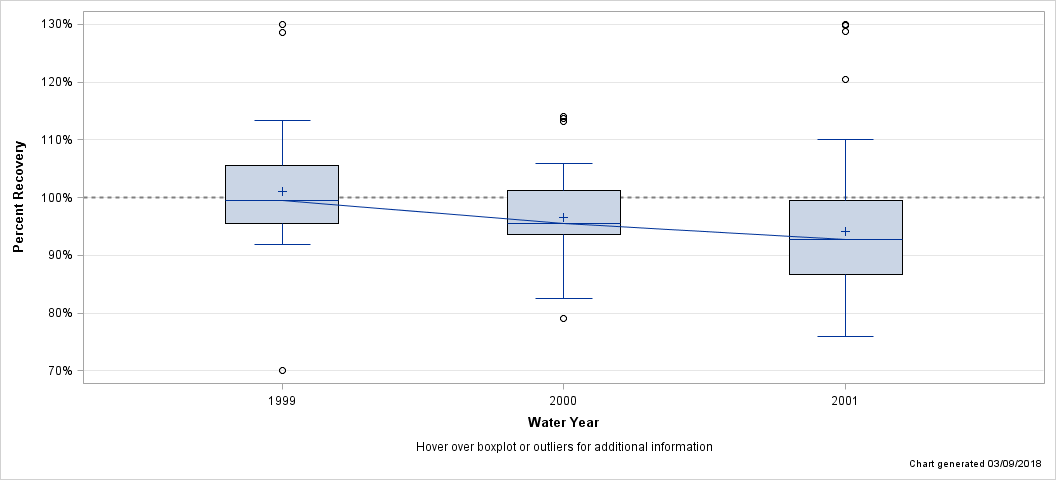
| Percent Recovery Statistics for Iron, UNF, ICP-OES |
| Analyte | Parm-meth Code | Water Year | # of Samples |
25th Pctl | 50th Pctl (Median) |
75th Pctl |
|---|---|---|---|---|---|---|
| Iron, UNF, ICP-OES | 01045PLA15 | 1999 | 22 | 95.4% | 99.6% | 105.6% |
| 2000 | 39 | 93.6% | 95.5% | 101.3% | ||
| 2001 | 59 | 86.7% | 92.7% | 99.6% |
| Hover over boxplot or outliers for additional information |
| Chart generated 03/09/2018 |
| - Lead, FIL, AA - |
| Lab: NWQL, PCode: 01049, MCode: CX007 |
| Login Dates: 10/14/86 through 05/08/89 |
| Open Data Set |
| Boxplot Description |
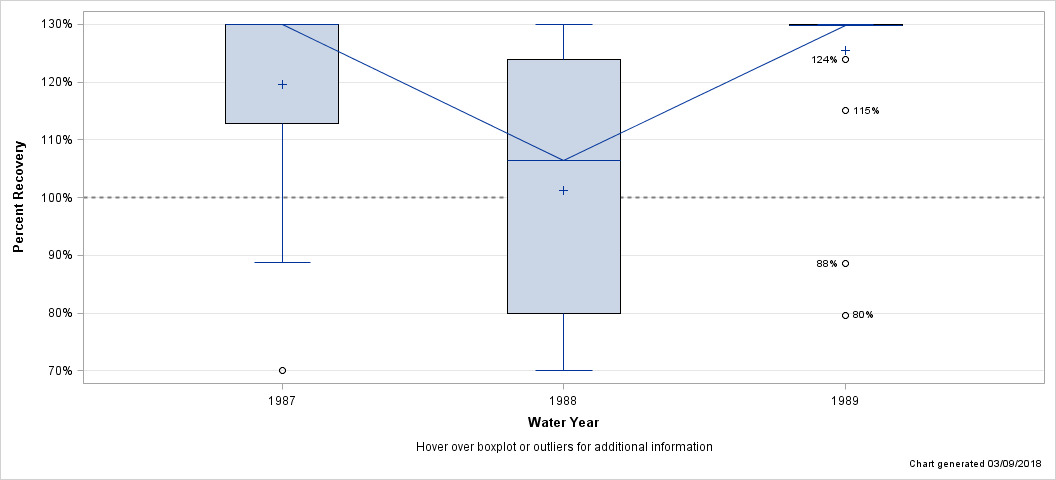
| Percent Recovery Statistics for Lead, FIL, AA |
| Analyte | Parm-meth Code | Water Year | # of Samples |
25th Pctl | 50th Pctl (Median) |
75th Pctl |
|---|---|---|---|---|---|---|
| Lead, FIL, AA | 01049CX007 | 1987 | 34 | 112.9% | 169.5% | 173.6% |
| 1988 | 87 | 80.0% | 106.4% | 123.9% | ||
| 1989 | 25 | 129.9% | 129.9% | 155.8% |
| Hover over boxplot or outliers for additional information |
| Chart generated 03/09/2018 |
| - Lead, FIL, GFAA - |
| Lab: NWQL, PCode: 01049, MCode: GF089 |
| Login Dates: 05/15/89 through 09/24/01 |
| Open Data Set |
| Boxplot Description |
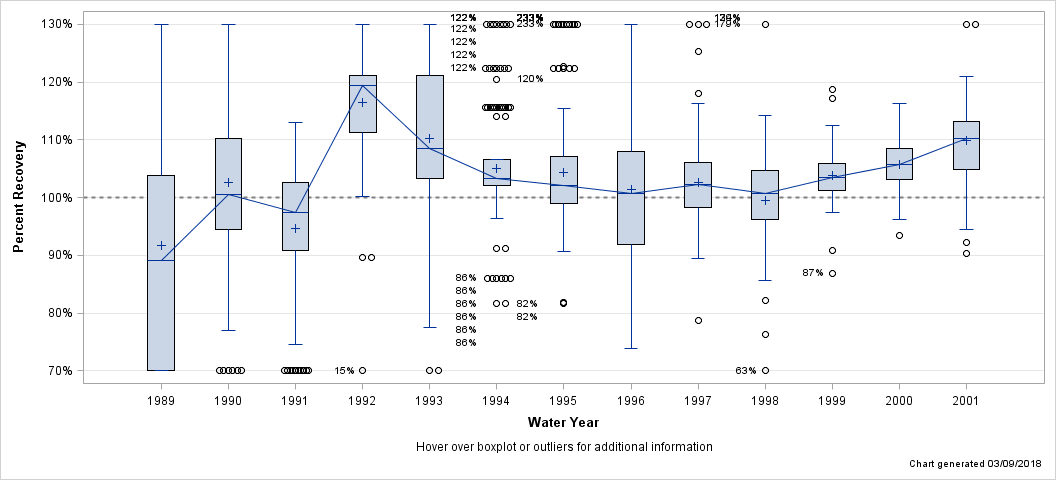
| Percent Recovery Statistics for Lead, FIL, GFAA |
| Analyte | Parm-meth Code | Water Year | # of Samples |
25th Pctl | 50th Pctl (Median) |
75th Pctl |
|---|---|---|---|---|---|---|
| Lead, FIL, GFAA | 01049GF089 | 1989 | 48 | 64.5% | 89.1% | 103.9% |
| 1990 | 181 | 94.5% | 100.6% | 110.2% | ||
| 1991 | 86 | 90.9% | 97.4% | 102.6% | ||
| 1992 | 127 | 111.4% | 119.4% | 121.1% | ||
| 1993 | 141 | 103.4% | 108.5% | 121.2% | ||
| 1994 | 121 | 102.0% | 103.3% | 106.5% | ||
| 1995 | 110 | 99.0% | 102.0% | 107.2% | ||
| 1996 | 87 | 91.8% | 100.7% | 107.9% | ||
| 1997 | 92 | 98.3% | 102.3% | 106.1% | ||
| 1998 | 48 | 96.2% | 100.7% | 104.7% | ||
| 1999 | 48 | 101.2% | 103.5% | 105.9% | ||
| 2000 | 48 | 103.1% | 105.8% | 108.5% | ||
| 2001 | 47 | 104.9% | 110.3% | 113.2% |
| Hover over boxplot or outliers for additional information |
| Chart generated 03/09/2018 |
| - Lead, FIL, GFAA, LL - |
| Lab: NWQL, PCode: 01049, MCode: GF078 |
| Login Dates: 03/06/87 through 09/13/95 |
| Open Data Set |
| Boxplot Description |
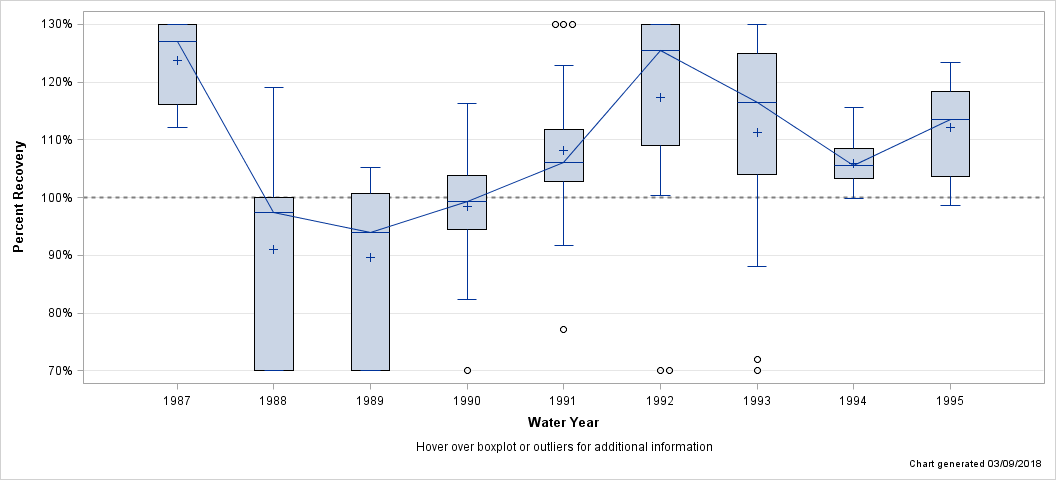
| Percent Recovery Statistics for Lead, FIL, GFAA, LL |
| Analyte | Parm-meth Code | Water Year | # of Samples |
25th Pctl | 50th Pctl (Median) |
75th Pctl |
|---|---|---|---|---|---|---|
| Lead, FIL, GFAA, LL | 01049GF078 | 1987 | 6 | 116.1% | 127.3% | 132.1% |
| 1988 | 9 | 42.4% | 97.3% | 100.0% | ||
| 1989 | 13 | 49.2% | 94.0% | 100.7% | ||
| 1990 | 17 | 94.5% | 99.4% | 103.9% | ||
| 1991 | 21 | 102.8% | 106.1% | 111.7% | ||
| 1992 | 24 | 109.0% | 125.5% | 145.6% | ||
| 1993 | 24 | 104.0% | 116.6% | 128.0% | ||
| 1994 | 24 | 103.3% | 105.5% | 108.4% | ||
| 1995 | 11 | 103.6% | 113.5% | 118.4% |
| Hover over boxplot or outliers for additional information |
| Chart generated 03/09/2018 |
| - Lead, FIL, ICP-MS - |
| Lab: NWQL, PCode: 01049, MCode: PLM43 |
| Login Dates: 02/07/94 through 09/27/01 |
| Open Data Set |
| Boxplot Description |
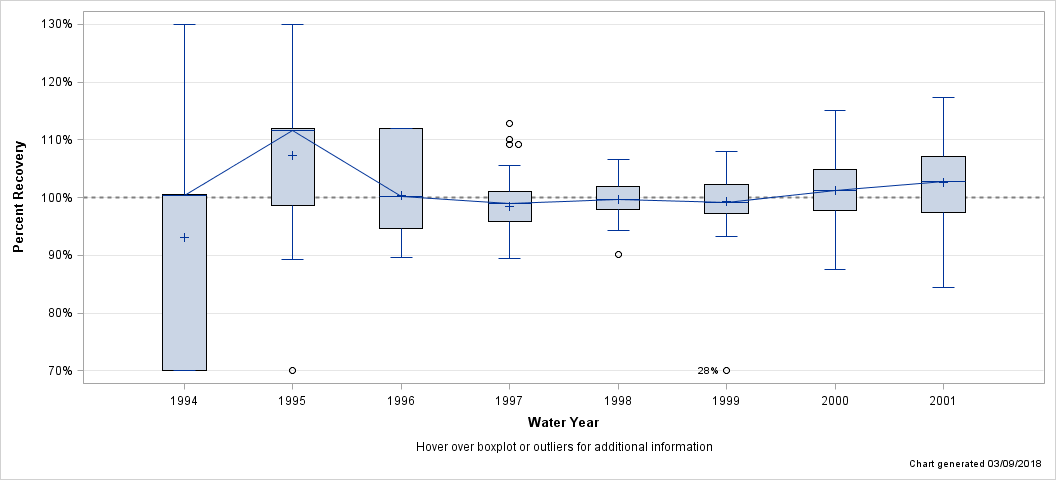
| Percent Recovery Statistics for Lead, FIL, ICP-MS |
| Analyte | Parm-meth Code | Water Year | # of Samples |
25th Pctl | 50th Pctl (Median) |
75th Pctl |
|---|---|---|---|---|---|---|
| Lead, FIL, ICP-MS | 01049PLM43 | 1994 | 32 | 66.7% | 100.3% | 100.6% |
| 1995 | 47 | 98.7% | 111.7% | 112.0% | ||
| 1996 | 46 | 94.7% | 100.3% | 112.0% | ||
| 1997 | 48 | 95.8% | 99.0% | 101.0% | ||
| 1998 | 96 | 97.9% | 99.7% | 101.9% | ||
| 1999 | 96 | 97.2% | 99.1% | 102.3% | ||
| 2000 | 72 | 97.8% | 101.3% | 104.9% | ||
| 2001 | 108 | 97.5% | 102.7% | 107.1% |
| Hover over boxplot or outliers for additional information |
| Chart generated 03/09/2018 |
| - Lead, FIL, ICP-OES - |
| Lab: NWQL, PCode: 01049, MCode: PLA11 |
| Login Dates: 10/14/86 through 08/03/00 |
| Open Data Set |
| Boxplot Description |
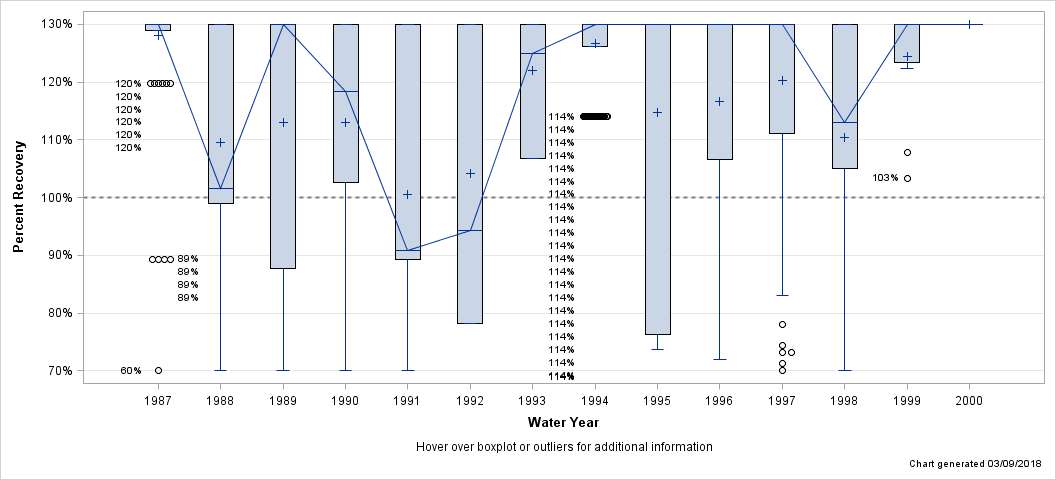
| Percent Recovery Statistics for Lead, FIL, ICP-OES |
| Analyte | Parm-meth Code | Water Year | # of Samples |
25th Pctl | 50th Pctl (Median) |
75th Pctl |
|---|---|---|---|---|---|---|
| Lead, FIL, ICP-OES | 01049PLA11 | 1987 | 162 | 129.0% | 133.3% | 256.4% |
| 1988 | 145 | 99.0% | 101.5% | 133.3% | ||
| 1989 | 123 | 87.7% | 137.0% | 193.8% | ||
| 1990 | 129 | 102.6% | 118.3% | 156.3% | ||
| 1991 | 190 | 89.3% | 90.9% | 133.9% | ||
| 1992 | 94 | 78.1% | 94.3% | 156.3% | ||
| 1993 | 132 | 106.7% | 125.0% | 450.5% | ||
| 1994 | 134 | 126.1% | 252.2% | 333.3% | ||
| 1995 | 135 | 76.3% | 204.6% | 228.9% | ||
| 1996 | 96 | 106.5% | 144.0% | 213.1% | ||
| 1997 | 96 | 111.2% | 166.7% | 209.3% | ||
| 1998 | 9 | 105.0% | 112.9% | 269.5% | ||
| 1999 | 12 | 123.4% | 141.6% | 183.3% | ||
| 2000 | 5 | 139.1% | 171.1% | 346.1% |
| Hover over boxplot or outliers for additional information |
| Chart generated 03/09/2018 |
| - Lead, UNF, AA - |
| Lab: NWQL, PCode: 01051, MCode: CX017 |
| Login Dates: 10/14/86 through 04/27/89 |
| Open Data Set |
| Boxplot Description |
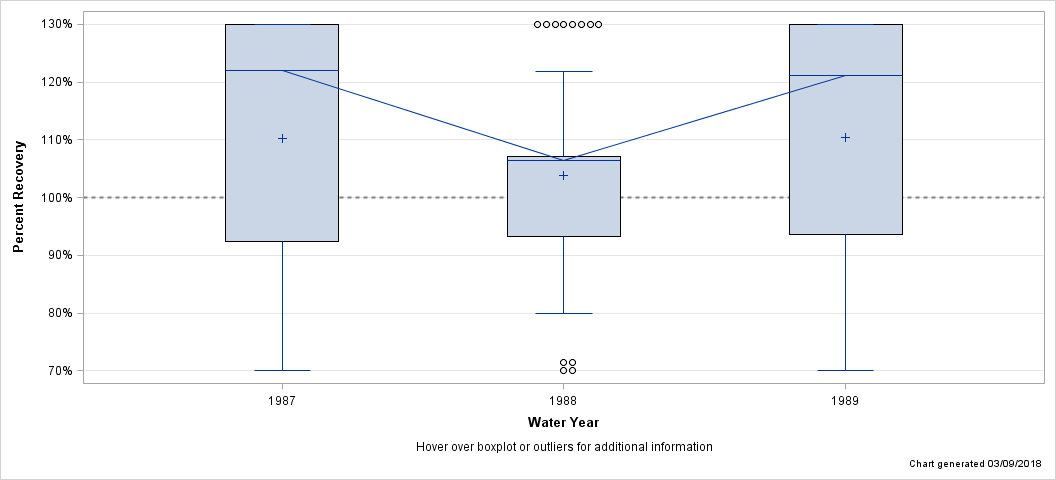
| Percent Recovery Statistics for Lead, UNF, AA |
| Analyte | Parm-meth Code | Water Year | # of Samples |
25th Pctl | 50th Pctl (Median) |
75th Pctl |
|---|---|---|---|---|---|---|
| Lead, UNF, AA | 01051CX017 | 1987 | 27 | 92.3% | 122.0% | 169.5% |
| 1988 | 46 | 93.3% | 106.4% | 107.1% | ||
| 1989 | 20 | 93.5% | 121.1% | 178.0% |
| Hover over boxplot or outliers for additional information |
| Chart generated 03/09/2018 |
| - Lead, UNF, GFAA - |
| Lab: NWQL, PCode: 01051, MCode: GF100 |
| Login Dates: 05/08/89 through 09/28/01 |
| Open Data Set |
| Boxplot Description |
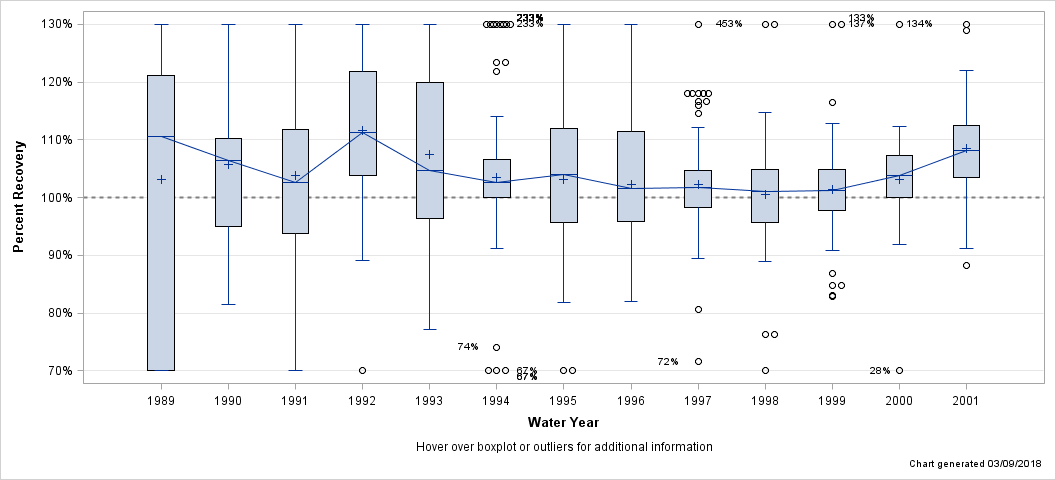
| Percent Recovery Statistics for Lead, UNF, GFAA |
| Analyte | Parm-meth Code | Water Year | # of Samples |
25th Pctl | 50th Pctl (Median) |
75th Pctl |
|---|---|---|---|---|---|---|
| Lead, UNF, GFAA | 01051GF100 | 1989 | 22 | 64.5% | 110.6% | 121.1% |
| 1990 | 65 | 95.0% | 106.5% | 110.2% | ||
| 1991 | 72 | 93.8% | 102.6% | 111.7% | ||
| 1992 | 67 | 103.8% | 111.4% | 121.8% | ||
| 1993 | 80 | 96.3% | 104.6% | 120.0% | ||
| 1994 | 120 | 100.0% | 102.6% | 106.5% | ||
| 1995 | 120 | 95.8% | 103.9% | 112.0% | ||
| 1996 | 102 | 95.8% | 101.5% | 111.4% | ||
| 1997 | 93 | 98.3% | 101.7% | 104.7% | ||
| 1998 | 72 | 95.8% | 101.0% | 104.8% | ||
| 1999 | 72 | 97.8% | 101.2% | 104.9% | ||
| 2000 | 59 | 100.0% | 103.9% | 107.3% | ||
| 2001 | 59 | 103.5% | 108.2% | 112.5% |
| Hover over boxplot or outliers for additional information |
| Chart generated 03/09/2018 |
| - Lithium, FIL, AA - |
| Lab: NWQL, PCode: 01130, MCode: AA021 |
| Login Dates: 01/11/90 through 03/27/96 |
| Open Data Set |
| Boxplot Description |
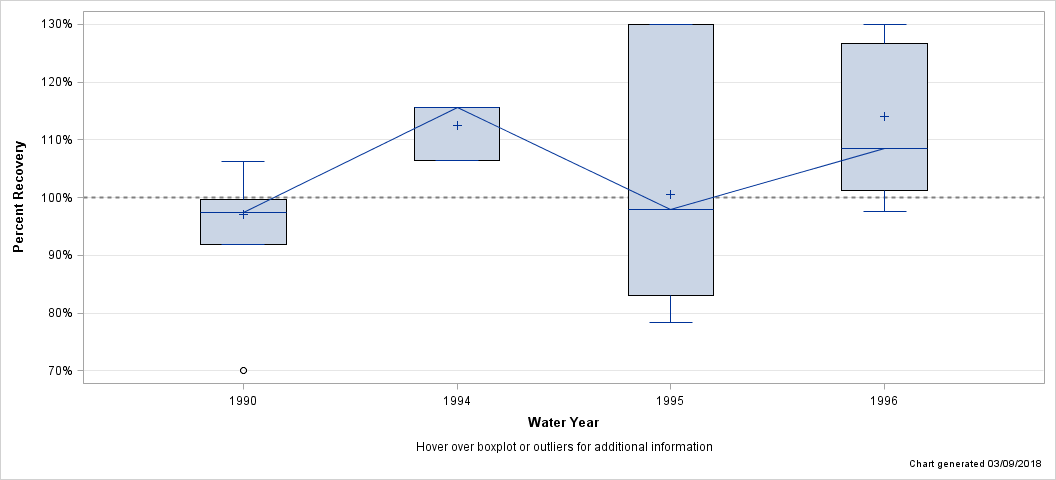
| Percent Recovery Statistics for Lithium, FIL, AA |
| Analyte | Parm-meth Code | Water Year | # of Samples |
25th Pctl | 50th Pctl (Median) |
75th Pctl |
|---|---|---|---|---|---|---|
| Lithium, FIL, AA | 01130AA021 | 1990 | 55 | 91.9% | 97.3% | 99.6% |
| 1994 | 3 | 106.4% | 115.6% | 115.6% | ||
| 1995 | 36 | 83.1% | 97.9% | 146.9% | ||
| 1996 | 11 | 101.3% | 108.5% | 126.6% |
| Hover over boxplot or outliers for additional information |
| Chart generated 03/09/2018 |
| - Lithium, FIL, ICP-OES - |
| Lab: NWQL, PCode: 01130, MCode: PLA11 |
| Login Dates: 10/14/86 through 09/27/01 |
| Open Data Set |
| Boxplot Description |
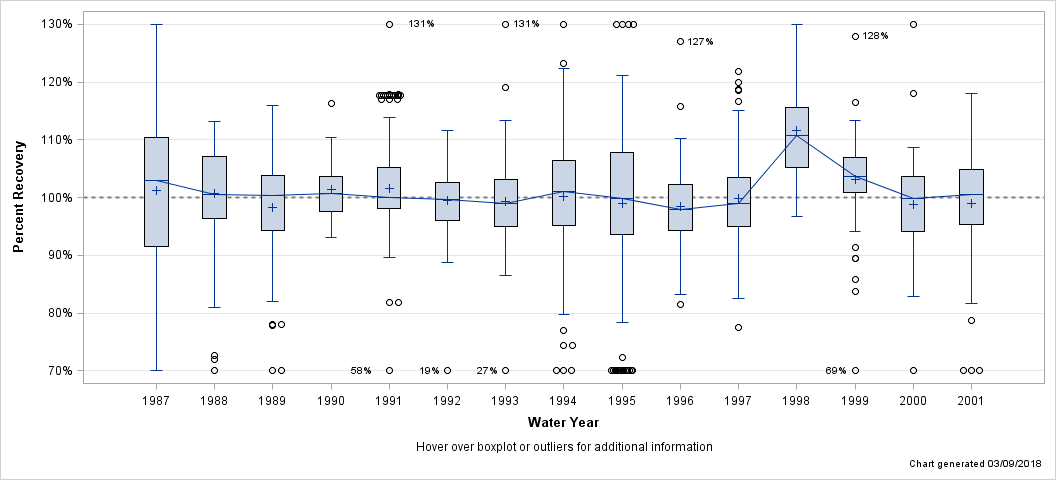
| Percent Recovery Statistics for Lithium, FIL, ICP-OES |
| Analyte | Parm-meth Code | Water Year | # of Samples |
25th Pctl | 50th Pctl (Median) |
75th Pctl |
|---|---|---|---|---|---|---|
| Lithium, FIL, ICP-OES | 01130PLA11 | 1987 | 162 | 91.4% | 103.0% | 110.3% |
| 1988 | 186 | 96.4% | 100.6% | 107.1% | ||
| 1989 | 123 | 94.3% | 100.3% | 103.8% | ||
| 1990 | 128 | 97.7% | 100.8% | 103.6% | ||
| 1991 | 191 | 98.0% | 100.0% | 105.3% | ||
| 1992 | 137 | 96.0% | 99.6% | 102.6% | ||
| 1993 | 178 | 94.9% | 99.0% | 103.1% | ||
| 1994 | 156 | 95.2% | 101.1% | 106.4% | ||
| 1995 | 135 | 93.7% | 99.8% | 107.7% | ||
| 1996 | 108 | 94.3% | 97.9% | 102.3% | ||
| 1997 | 117 | 95.0% | 98.9% | 103.5% | ||
| 1998 | 96 | 105.2% | 110.7% | 115.6% | ||
| 1999 | 93 | 100.9% | 103.7% | 107.0% | ||
| 2000 | 60 | 94.1% | 99.8% | 103.7% | ||
| 2001 | 60 | 95.3% | 100.5% | 104.9% |
| Hover over boxplot or outliers for additional information |
| Chart generated 03/09/2018 |
| - Lithium, UNF, AA - |
| Lab: NWQL, PCode: 01132, MCode: AA057 |
| Login Dates: 10/14/86 through 09/24/98 |
| Open Data Set |
| Boxplot Description |
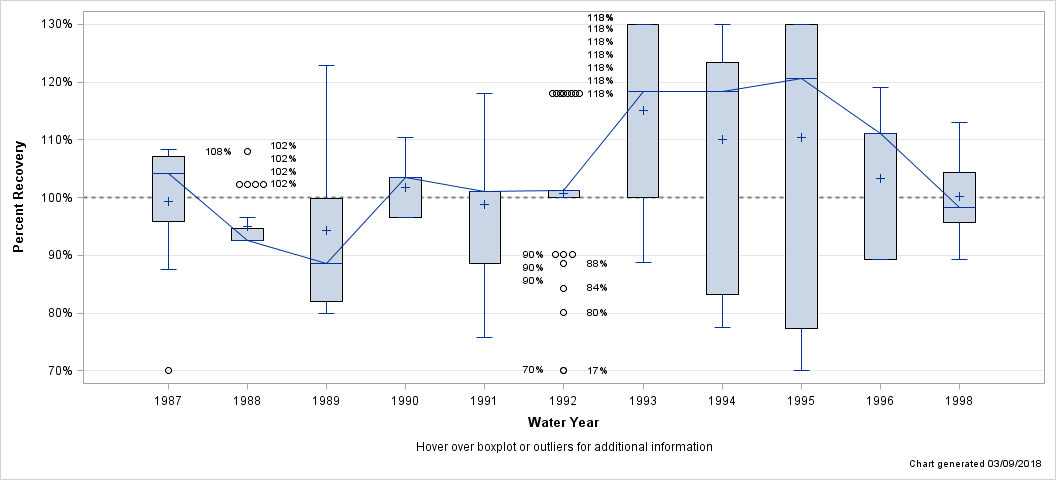
| Percent Recovery Statistics for Lithium, UNF, AA |
| Analyte | Parm-meth Code | Water Year | # of Samples |
25th Pctl | 50th Pctl (Median) |
75th Pctl |
|---|---|---|---|---|---|---|
| Lithium, UNF, AA | 01132AA057 | 1987 | 12 | 95.8% | 104.2% | 107.1% |
| 1988 | 24 | 92.6% | 92.6% | 94.6% | ||
| 1989 | 26 | 82.0% | 88.5% | 99.8% | ||
| 1990 | 16 | 96.6% | 103.4% | 103.4% | ||
| 1991 | 21 | 88.5% | 101.0% | 101.0% | ||
| 1992 | 34 | 100.1% | 101.2% | 101.2% | ||
| 1993 | 34 | 100.0% | 118.3% | 133.3% | ||
| 1994 | 24 | 83.1% | 118.3% | 123.5% | ||
| 1995 | 24 | 77.3% | 132.8% | 154.6% | ||
| 1996 | 21 | 89.3% | 111.1% | 111.1% | ||
| 1998 | 13 | 95.7% | 98.2% | 104.3% |
| Hover over boxplot or outliers for additional information |
| Chart generated 03/09/2018 |
| - Lithium, UNF, ICP-OES - |
| Lab: NWQL, PCode: 01132, MCode: PLA15 |
| Login Dates: 04/26/99 through 09/14/01 |
| Open Data Set |
| Boxplot Description |
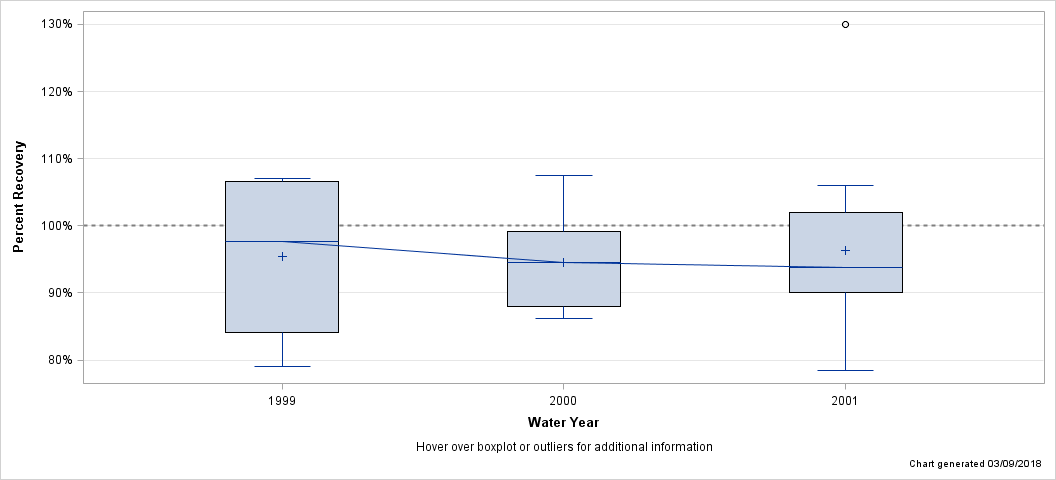
| Percent Recovery Statistics for Lithium, UNF, ICP-OES |
| Analyte | Parm-meth Code | Water Year | # of Samples |
25th Pctl | 50th Pctl (Median) |
75th Pctl |
|---|---|---|---|---|---|---|
| Lithium, UNF, ICP-OES | 01132PLA15 | 1999 | 4 | 84.2% | 97.7% | 106.6% |
| 2000 | 11 | 88.0% | 94.6% | 99.2% | ||
| 2001 | 12 | 90.0% | 93.8% | 102.0% |
| Hover over boxplot or outliers for additional information |
| Chart generated 03/09/2018 |
| - Manganese, FIL, AA - |
| Lab: NWQL, PCode: 01056, MCode: AA025 |
| Login Dates: 10/14/86 through 03/29/96 |
| Open Data Set |
| Boxplot Description |
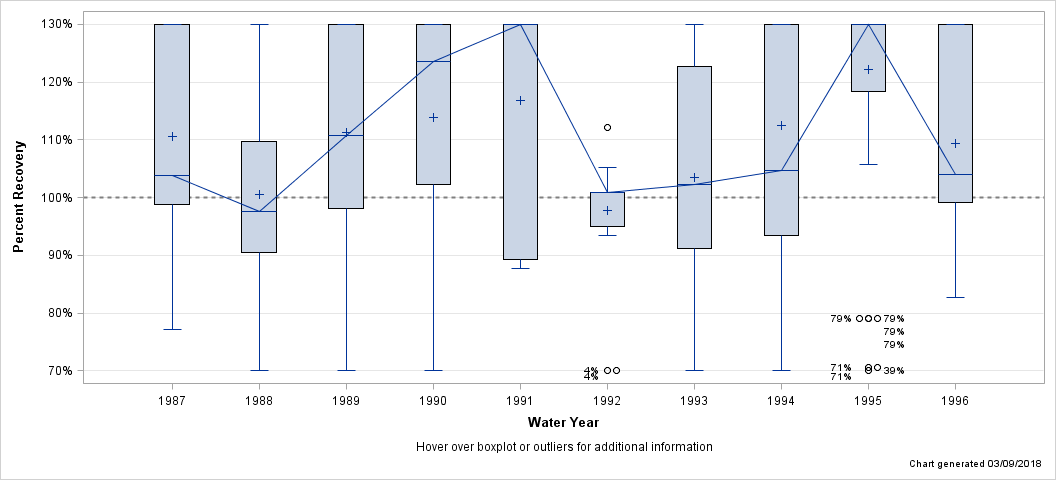
| Percent Recovery Statistics for Manganese, FIL, AA |
| Analyte | Parm-meth Code | Water Year | # of Samples |
25th Pctl | 50th Pctl (Median) |
75th Pctl |
|---|---|---|---|---|---|---|
| Manganese, FIL, AA | 01056AA025 | 1987 | 34 | 98.7% | 103.8% | 500.0% |
| 1988 | 46 | 90.5% | 97.6% | 109.8% | ||
| 1989 | 74 | 98.0% | 110.7% | 222.2% | ||
| 1990 | 110 | 102.2% | 123.6% | 148.1% | ||
| 1991 | 25 | 89.3% | 131.6% | 175.4% | ||
| 1992 | 48 | 95.0% | 100.9% | 100.9% | ||
| 1993 | 96 | 91.2% | 102.2% | 122.7% | ||
| 1994 | 99 | 93.5% | 104.7% | 147.1% | ||
| 1995 | 109 | 118.5% | 147.1% | 274.9% | ||
| 1996 | 43 | 99.2% | 104.0% | 245.6% |
| Hover over boxplot or outliers for additional information |
| Chart generated 03/09/2018 |
| - Manganese, FIL, ICP-MS - |
| Lab: NWQL, PCode: 01056, MCode: PLM43 |
| Login Dates: 02/07/94 through 09/27/01 |
| Open Data Set |
| Boxplot Description |
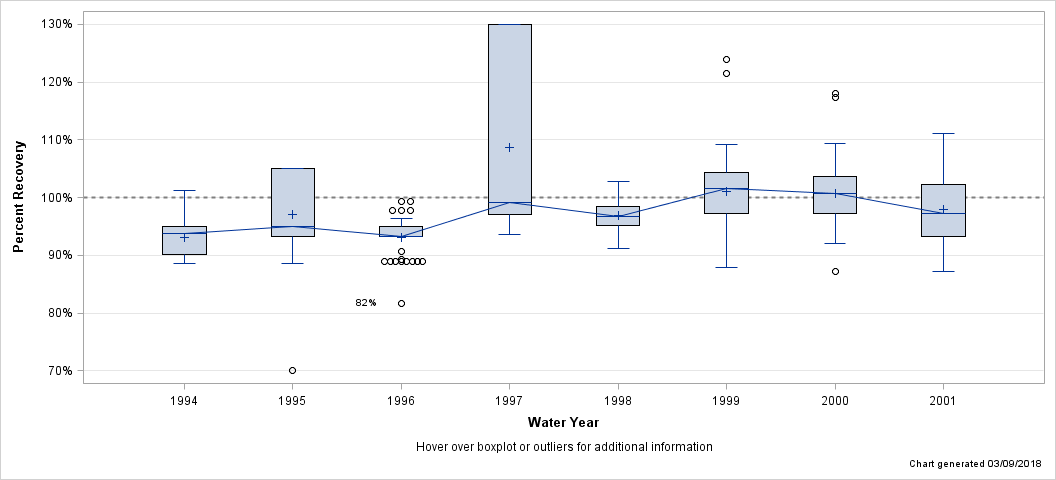
| Percent Recovery Statistics for Manganese, FIL, ICP-MS |
| Analyte | Parm-meth Code | Water Year | # of Samples |
25th Pctl | 50th Pctl (Median) |
75th Pctl |
|---|---|---|---|---|---|---|
| Manganese, FIL, ICP-MS | 01056PLM43 | 1994 | 32 | 90.1% | 93.8% | 94.9% |
| 1995 | 47 | 93.3% | 94.9% | 105.0% | ||
| 1996 | 46 | 93.3% | 93.3% | 95.0% | ||
| 1997 | 48 | 97.1% | 99.2% | 166.7% | ||
| 1998 | 96 | 95.1% | 96.6% | 98.5% | ||
| 1999 | 96 | 97.2% | 101.5% | 104.3% | ||
| 2000 | 72 | 97.2% | 100.7% | 103.6% | ||
| 2001 | 71 | 93.2% | 97.3% | 102.3% |
| Hover over boxplot or outliers for additional information |
| Chart generated 03/09/2018 |
| - Manganese, FIL, ICP-OES - |
| Lab: NWQL, PCode: 01056, MCode: PLA11 |
| Login Dates: 10/14/86 through 09/27/01 |
| Open Data Set |
| Boxplot Description |
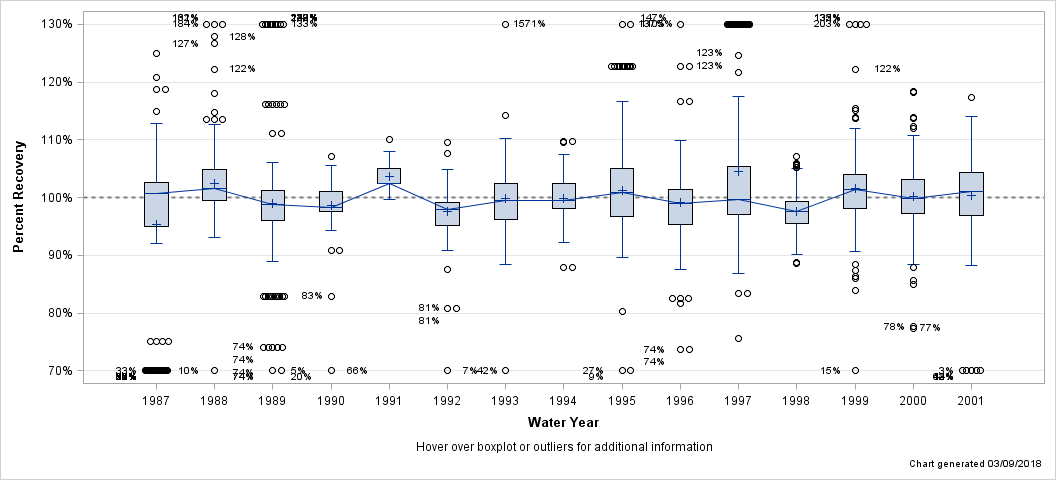
| Percent Recovery Statistics for Manganese, FIL, ICP-OES |
| Analyte | Parm-meth Code | Water Year | # of Samples |
25th Pctl | 50th Pctl (Median) |
75th Pctl |
|---|---|---|---|---|---|---|
| Manganese, FIL, ICP-OES | 01056PLA11 | 1987 | 162 | 95.0% | 100.7% | 102.6% |
| 1988 | 186 | 99.4% | 101.6% | 104.8% | ||
| 1989 | 123 | 96.0% | 98.8% | 101.2% | ||
| 1990 | 74 | 97.6% | 98.2% | 101.0% | ||
| 1991 | 58 | 102.4% | 102.4% | 105.0% | ||
| 1992 | 212 | 95.1% | 97.9% | 99.1% | ||
| 1993 | 223 | 96.2% | 99.5% | 102.4% | ||
| 1994 | 202 | 98.1% | 99.4% | 102.5% | ||
| 1995 | 230 | 96.8% | 100.9% | 105.0% | ||
| 1996 | 227 | 95.3% | 99.1% | 101.4% | ||
| 1997 | 211 | 97.1% | 99.6% | 105.4% | ||
| 1998 | 190 | 95.5% | 97.5% | 99.3% | ||
| 1999 | 237 | 98.1% | 101.3% | 104.0% | ||
| 2000 | 238 | 97.2% | 99.8% | 103.1% | ||
| 2001 | 236 | 96.9% | 101.1% | 104.3% |
| Hover over boxplot or outliers for additional information |
| Chart generated 03/09/2018 |
| - Manganese, FIL, ICP-OES, LL - |
| Lab: NWQL, PCode: 01056, MCode: PLA09 |
| Login Dates: 10/08/92 through 09/27/94 |
| Open Data Set |
| Boxplot Description |
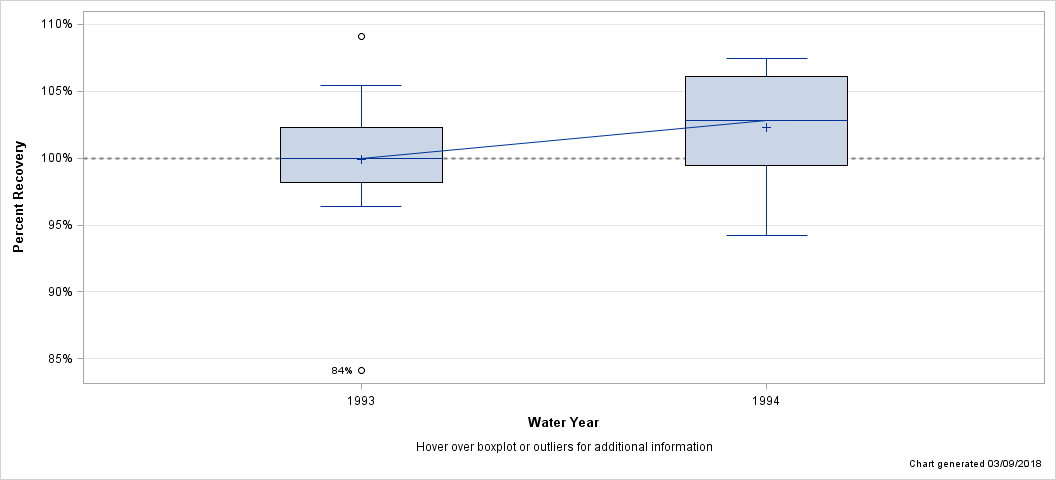
| Percent Recovery Statistics for Manganese, FIL, ICP-OES, LL |
| Analyte | Parm-meth Code | Water Year | # of Samples |
25th Pctl | 50th Pctl (Median) |
75th Pctl |
|---|---|---|---|---|---|---|
| Manganese, FIL, ICP-OES, LL | 01056PLA09 | 1993 | 24 | 98.2% | 100.0% | 102.3% |
| 1994 | 24 | 99.5% | 102.8% | 106.1% |
| Hover over boxplot or outliers for additional information |
| Chart generated 03/09/2018 |
| - Manganese, UNF, AA - |
| Lab: NWQL, PCode: 01055, MCode: AA060 |
| Login Dates: 10/14/86 through 03/15/99 |
| Open Data Set |
| Boxplot Description |
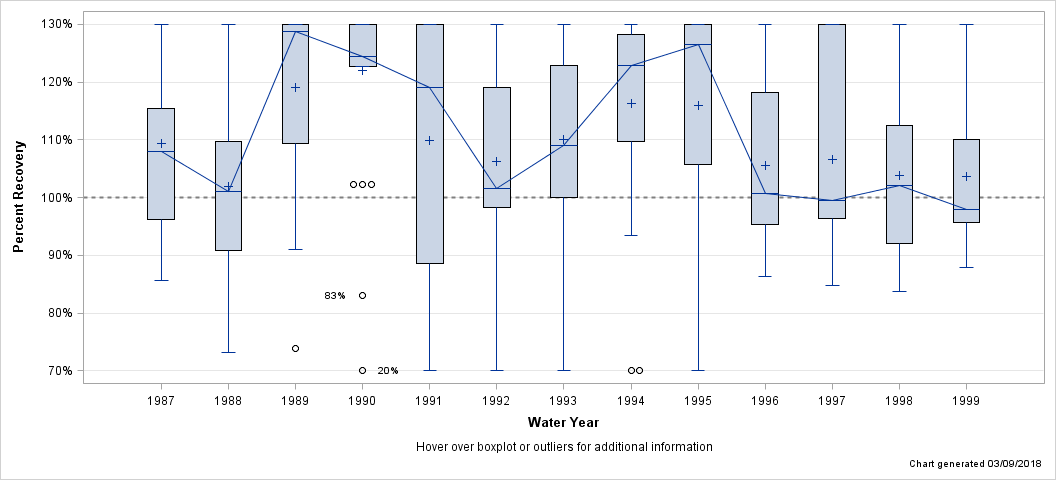
| Percent Recovery Statistics for Manganese, UNF, AA |
| Analyte | Parm-meth Code | Water Year | # of Samples |
25th Pctl | 50th Pctl (Median) |
75th Pctl |
|---|---|---|---|---|---|---|
| Manganese, UNF, AA | 01055AA060 | 1987 | 27 | 96.2% | 108.0% | 115.4% |
| 1988 | 46 | 90.9% | 101.0% | 109.8% | ||
| 1989 | 42 | 109.3% | 131.1% | 148.1% | ||
| 1990 | 38 | 122.7% | 124.5% | 166.0% | ||
| 1991 | 36 | 88.5% | 119.0% | 145.2% | ||
| 1992 | 82 | 98.4% | 101.6% | 119.0% | ||
| 1993 | 80 | 100.0% | 109.1% | 123.0% | ||
| 1994 | 60 | 109.8% | 123.0% | 133.4% | ||
| 1995 | 60 | 105.8% | 126.6% | 141.1% | ||
| 1996 | 44 | 95.3% | 100.7% | 118.2% | ||
| 1997 | 45 | 96.5% | 99.4% | 147.1% | ||
| 1998 | 42 | 92.1% | 102.2% | 112.5% | ||
| 1999 | 24 | 95.7% | 97.9% | 110.1% |
| Hover over boxplot or outliers for additional information |
| Chart generated 03/09/2018 |
| - Manganese, UNF, ICP-OES - |
| Lab: NWQL, PCode: 01055, MCode: PLA15 |
| Login Dates: 04/05/99 through 09/24/01 |
| Open Data Set |
| Boxplot Description |
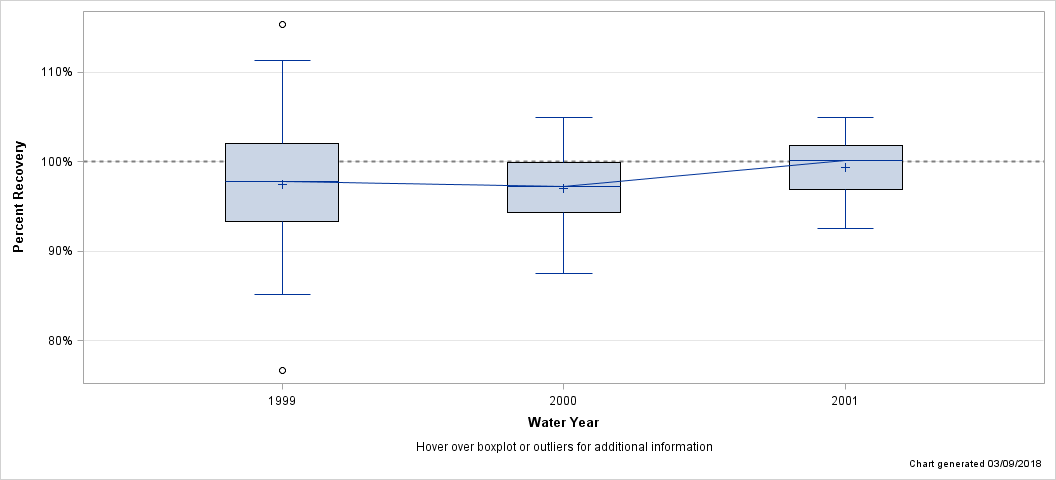
| Percent Recovery Statistics for Manganese, UNF, ICP-OES |
| Analyte | Parm-meth Code | Water Year | # of Samples |
25th Pctl | 50th Pctl (Median) |
75th Pctl |
|---|---|---|---|---|---|---|
| Manganese, UNF, ICP-OES | 01055PLA15 | 1999 | 32 | 93.3% | 97.8% | 102.1% |
| 2000 | 35 | 94.3% | 97.2% | 99.9% | ||
| 2001 | 35 | 96.9% | 100.2% | 101.9% |
| Hover over boxplot or outliers for additional information |
| Chart generated 03/09/2018 |
| - Mercury, FIL,CVAA - |
| Lab: NWQL, PCode: 71890, MCode: CV013 |
| Login Dates: 10/14/86 through 03/23/01 |
| Open Data Set |
| Boxplot Description |
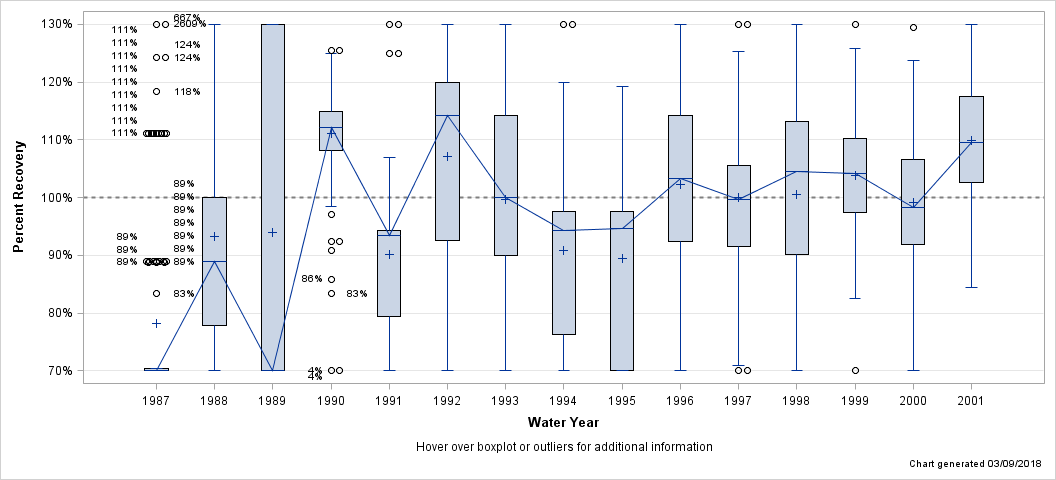
| Percent Recovery Statistics for Mercury, FIL,CVAA |
| Analyte | Parm-meth Code | Water Year | # of Samples |
25th Pctl | 50th Pctl (Median) |
75th Pctl |
|---|---|---|---|---|---|---|
| Mercury, FIL,CVAA | 71890CV013 | 1987 | 103 | 40.1% | 62.1% | 70.3% |
| 1988 | 77 | 77.8% | 88.9% | 100.0% | ||
| 1989 | 30 | 29.6% | 49.8% | 149.3% | ||
| 1990 | 125 | 108.2% | 112.1% | 115.0% | ||
| 1991 | 83 | 79.4% | 93.5% | 94.3% | ||
| 1992 | 128 | 92.6% | 114.3% | 120.0% | ||
| 1993 | 139 | 89.9% | 100.0% | 114.3% | ||
| 1994 | 118 | 76.2% | 94.3% | 97.6% | ||
| 1995 | 110 | 61.5% | 94.7% | 97.6% | ||
| 1996 | 87 | 92.3% | 103.3% | 114.3% | ||
| 1997 | 92 | 91.5% | 99.7% | 105.6% | ||
| 1998 | 48 | 90.2% | 104.6% | 113.2% | ||
| 1999 | 48 | 97.4% | 104.1% | 110.2% | ||
| 2000 | 48 | 91.9% | 98.2% | 106.5% | ||
| 2001 | 24 | 102.6% | 109.5% | 117.5% |
| Hover over boxplot or outliers for additional information |
| Chart generated 03/09/2018 |
| - Mercury, UNF,CVAA - |
| Lab: NWQL, PCode: 71900, MCode: CV016 |
| Login Dates: 12/04/86 through 03/23/01 |
| Open Data Set |
| Boxplot Description |
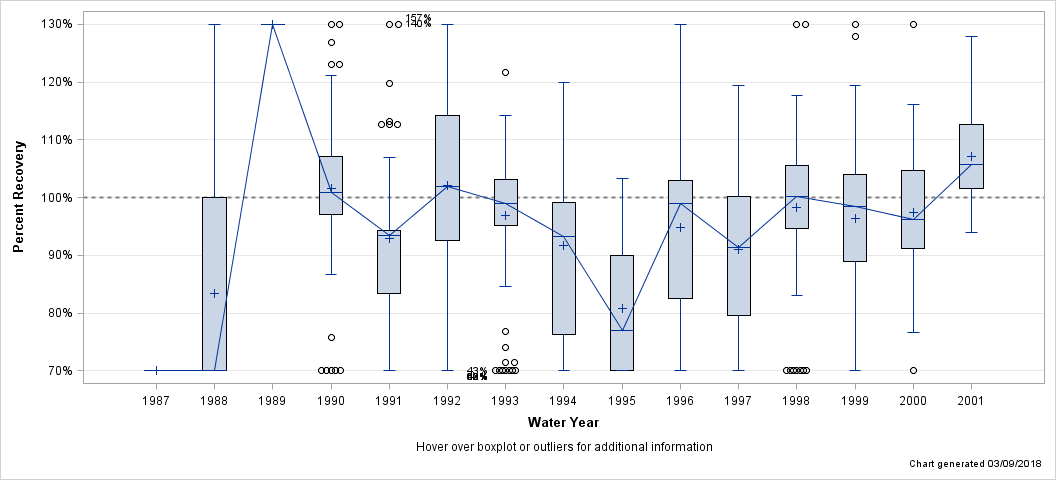
| Percent Recovery Statistics for Mercury, UNF,CVAA |
| Analyte | Parm-meth Code | Water Year | # of Samples |
25th Pctl | 50th Pctl (Median) |
75th Pctl |
|---|---|---|---|---|---|---|
| Mercury, UNF,CVAA | 71900CV016 | 1987 | 17 | 12.1% | 22.1% | 27.7% |
| 1988 | 29 | 41.7% | 41.7% | 100.0% | ||
| 1989 | 8 | 223.9% | 895.5% | 1818% | ||
| 1990 | 80 | 97.0% | 100.8% | 107.2% | ||
| 1991 | 72 | 83.3% | 93.5% | 94.3% | ||
| 1992 | 75 | 92.6% | 101.9% | 114.3% | ||
| 1993 | 80 | 95.2% | 98.9% | 103.2% | ||
| 1994 | 58 | 76.2% | 93.3% | 99.2% | ||
| 1995 | 59 | 61.5% | 76.9% | 90.0% | ||
| 1996 | 44 | 82.5% | 99.0% | 102.9% | ||
| 1997 | 45 | 79.6% | 91.4% | 100.3% | ||
| 1998 | 46 | 94.7% | 100.2% | 105.5% | ||
| 1999 | 47 | 88.9% | 98.4% | 104.0% | ||
| 2000 | 35 | 91.1% | 96.2% | 104.8% | ||
| 2001 | 18 | 101.6% | 105.7% | 112.7% |
| Hover over boxplot or outliers for additional information |
| Chart generated 03/09/2018 |
| - Molybdenum, FIL, GFAA - |
| Lab: NWQL, PCode: 01060, MCode: GF080 |
| Login Dates: 11/09/94 through 09/19/01 |
| Open Data Set |
| Boxplot Description |
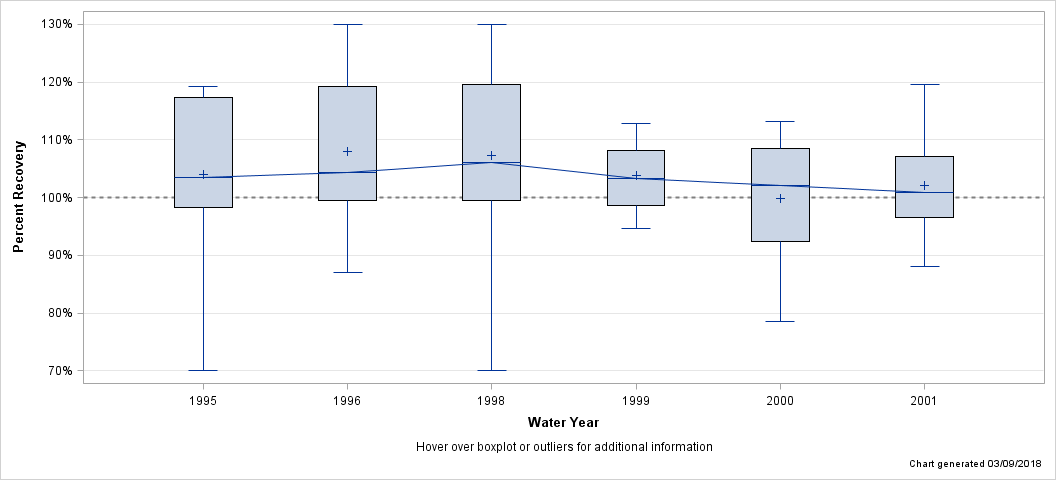
| Percent Recovery Statistics for Molybdenum, FIL, GFAA |
| Analyte | Parm-meth Code | Water Year | # of Samples |
25th Pctl | 50th Pctl (Median) |
75th Pctl |
|---|---|---|---|---|---|---|
| Molybdenum, FIL, GFAA | 01060GF080 | 1995 | 40 | 98.2% | 103.5% | 117.3% |
| 1996 | 46 | 99.5% | 104.3% | 119.3% | ||
| 1998 | 12 | 99.5% | 106.0% | 119.6% | ||
| 1999 | 12 | 98.7% | 103.2% | 108.2% | ||
| 2000 | 12 | 92.3% | 102.0% | 108.5% | ||
| 2001 | 12 | 96.6% | 100.8% | 107.1% |
| Hover over boxplot or outliers for additional information |
| Chart generated 03/09/2018 |
| - Molybdenum, FIL, ICP-MS - |
| Lab: NWQL, PCode: 01060, MCode: PLM43 |
| Login Dates: 02/07/94 through 09/27/01 |
| Open Data Set |
| Boxplot Description |
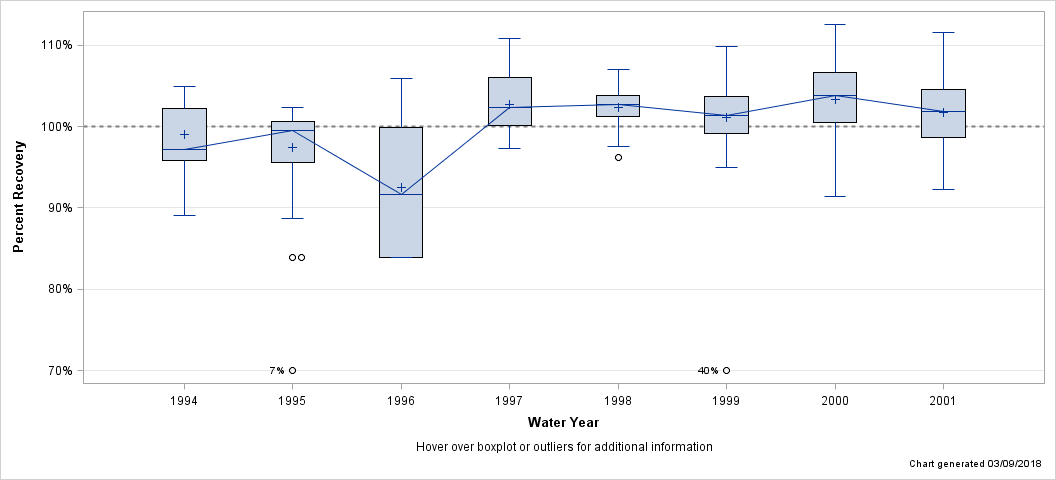
| Percent Recovery Statistics for Molybdenum, FIL, ICP-MS |
| Analyte | Parm-meth Code | Water Year | # of Samples |
25th Pctl | 50th Pctl (Median) |
75th Pctl |
|---|---|---|---|---|---|---|
| Molybdenum, FIL, ICP-MS | 01060PLM43 | 1994 | 32 | 95.9% | 97.1% | 102.2% |
| 1995 | 47 | 95.6% | 99.5% | 100.6% | ||
| 1996 | 46 | 83.9% | 91.7% | 99.8% | ||
| 1997 | 48 | 100.1% | 102.3% | 106.0% | ||
| 1998 | 96 | 101.3% | 102.7% | 103.8% | ||
| 1999 | 96 | 99.1% | 101.3% | 103.7% | ||
| 2000 | 72 | 100.5% | 103.8% | 106.6% | ||
| 2001 | 71 | 98.7% | 101.9% | 104.6% |
| Hover over boxplot or outliers for additional information |
| Chart generated 03/09/2018 |
| - Molybdenum, FIL, ICP-OES - |
| Lab: NWQL, PCode: 01060, MCode: PLA11 |
| Login Dates: 10/14/86 through 08/23/01 |
| Open Data Set |
| Boxplot Description |
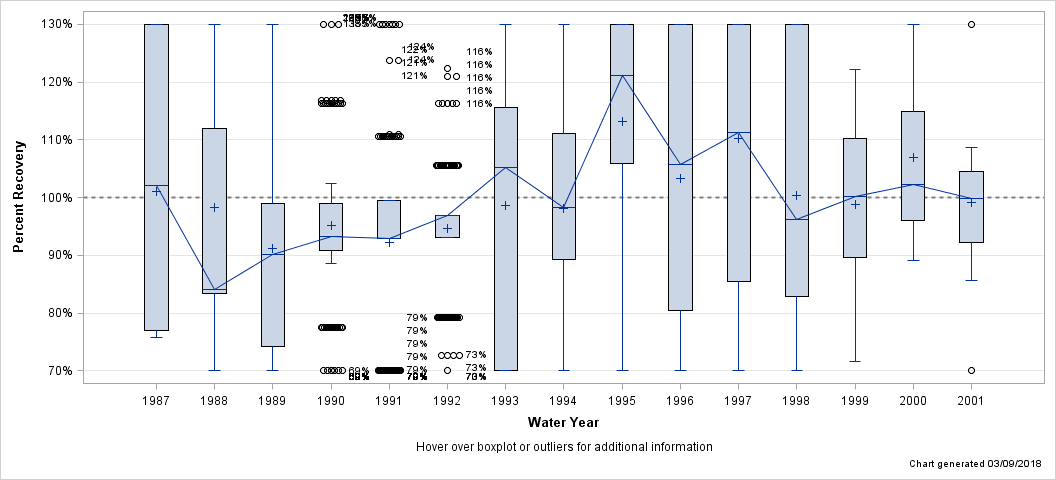
| Percent Recovery Statistics for Molybdenum, FIL, ICP-OES |
| Analyte | Parm-meth Code | Water Year | # of Samples |
25th Pctl | 50th Pctl (Median) |
75th Pctl |
|---|---|---|---|---|---|---|
| Molybdenum, FIL, ICP-OES | 01060PLA11 | 1987 | 162 | 76.9% | 102.1% | 141.8% |
| 1988 | 186 | 83.3% | 84.0% | 112.0% | ||
| 1989 | 123 | 74.3% | 90.1% | 99.0% | ||
| 1990 | 128 | 90.8% | 93.2% | 99.0% | ||
| 1991 | 185 | 92.9% | 92.9% | 99.6% | ||
| 1992 | 133 | 93.0% | 96.9% | 96.9% | ||
| 1993 | 133 | 58.5% | 105.3% | 115.6% | ||
| 1994 | 134 | 89.3% | 98.4% | 111.1% | ||
| 1995 | 135 | 106.0% | 121.1% | 167.7% | ||
| 1996 | 96 | 80.4% | 105.8% | 160.8% | ||
| 1997 | 96 | 85.5% | 111.3% | 181.8% | ||
| 1998 | 15 | 82.9% | 96.2% | 146.8% | ||
| 1999 | 13 | 89.6% | 100.2% | 110.2% | ||
| 2000 | 25 | 96.0% | 102.3% | 114.9% | ||
| 2001 | 12 | 92.3% | 99.9% | 104.6% |
| Hover over boxplot or outliers for additional information |
| Chart generated 03/09/2018 |
| - Molybdenum, FIL,CXAA - |
| Lab: NWQL, PCode: 01060, MCode: CX009 |
| Login Dates: 10/14/86 through 10/27/94 |
| Open Data Set |
| Boxplot Description |
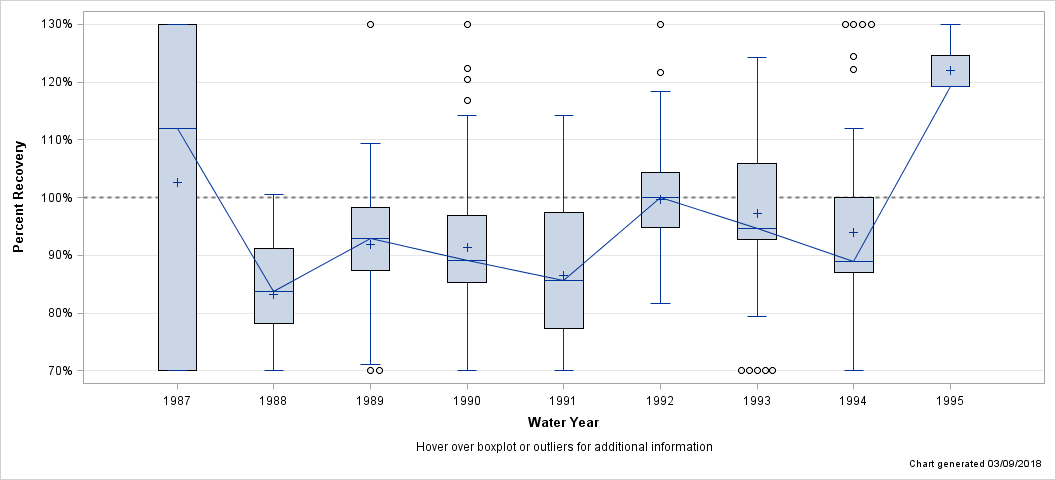
| Percent Recovery Statistics for Molybdenum, FIL,CXAA |
| Analyte | Parm-meth Code | Water Year | # of Samples |
25th Pctl | 50th Pctl (Median) |
75th Pctl |
|---|---|---|---|---|---|---|
| Molybdenum, FIL,CXAA | 01060CX009 | 1987 | 19 | 63.8% | 112.0% | 144.0% |
| 1988 | 23 | 78.2% | 83.8% | 91.1% | ||
| 1989 | 58 | 87.4% | 92.9% | 98.4% | ||
| 1990 | 113 | 85.3% | 89.1% | 96.9% | ||
| 1991 | 46 | 77.4% | 85.7% | 97.3% | ||
| 1992 | 94 | 94.9% | 100.0% | 104.3% | ||
| 1993 | 94 | 92.7% | 94.7% | 106.0% | ||
| 1994 | 97 | 87.0% | 88.9% | 100.0% | ||
| 1995 | 4 | 119.3% | 119.3% | 298.3% |
| Hover over boxplot or outliers for additional information |
| Chart generated 03/09/2018 |
| - Molybdenum, UNF, GFAA - |
| Lab: NWQL, PCode: 01062, MCode: GF095 |
| Login Dates: 11/07/94 through 09/14/01 |
| Open Data Set |
| Boxplot Description |
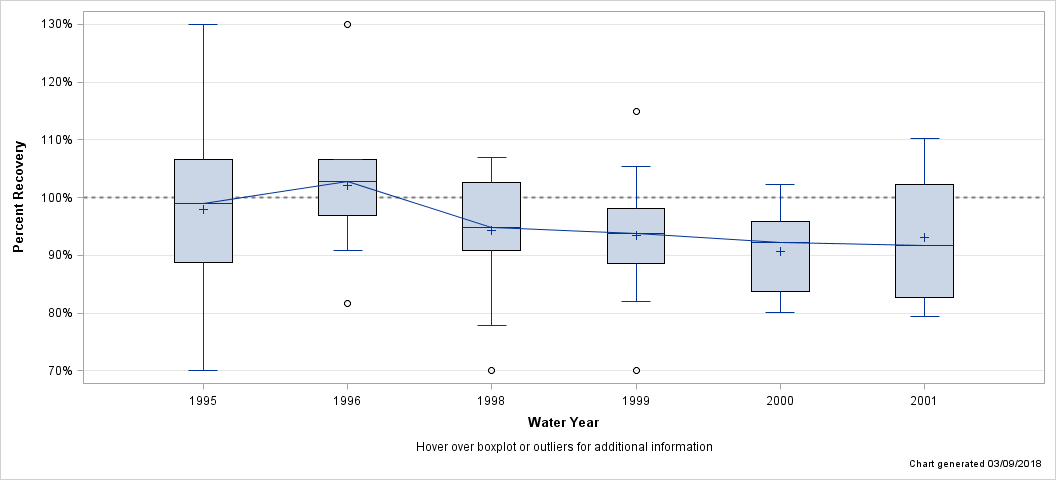
| Percent Recovery Statistics for Molybdenum, UNF, GFAA |
| Analyte | Parm-meth Code | Water Year | # of Samples |
25th Pctl | 50th Pctl (Median) |
75th Pctl |
|---|---|---|---|---|---|---|
| Molybdenum, UNF, GFAA | 01062GF095 | 1995 | 22 | 88.7% | 99.0% | 106.6% |
| 1996 | 21 | 96.8% | 102.9% | 106.6% | ||
| 1998 | 24 | 90.8% | 94.9% | 102.6% | ||
| 1999 | 24 | 88.6% | 93.7% | 98.0% | ||
| 2000 | 11 | 83.7% | 92.3% | 95.8% | ||
| 2001 | 12 | 82.7% | 91.8% | 102.2% |
| Hover over boxplot or outliers for additional information |
| Chart generated 03/09/2018 |
| - Molybdenum, UNF,CXAA - |
| Lab: NWQL, PCode: 01062, MCode: CX018 |
| Login Dates: 10/14/86 through 09/26/94 |
| Open Data Set |
| Boxplot Description |
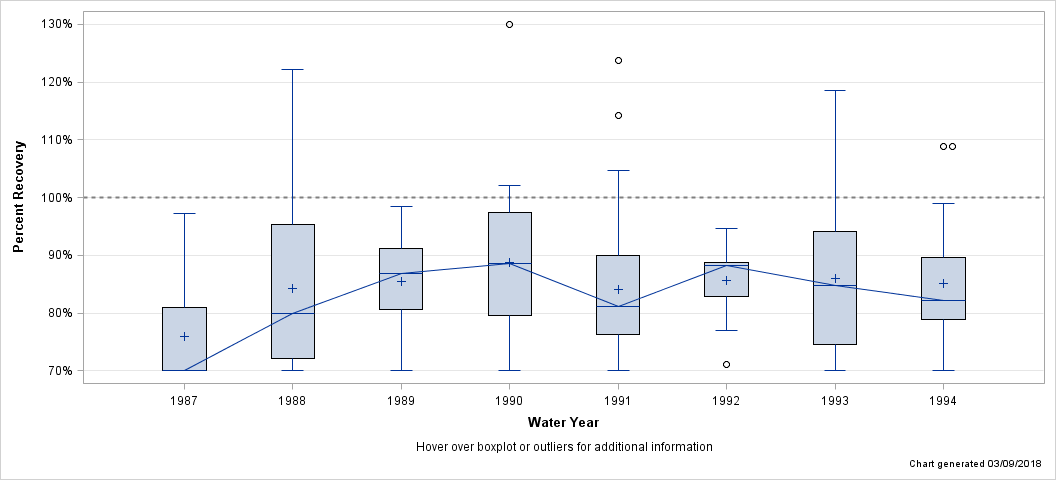
| Percent Recovery Statistics for Molybdenum, UNF,CXAA |
| Analyte | Parm-meth Code | Water Year | # of Samples |
25th Pctl | 50th Pctl (Median) |
75th Pctl |
|---|---|---|---|---|---|---|
| Molybdenum, UNF,CXAA | 01062CX018 | 1987 | 12 | 27.8% | 48.6% | 81.0% |
| 1988 | 24 | 72.2% | 79.9% | 95.4% | ||
| 1989 | 26 | 80.6% | 86.8% | 91.2% | ||
| 1990 | 16 | 79.6% | 88.5% | 97.3% | ||
| 1991 | 32 | 76.2% | 81.2% | 90.0% | ||
| 1992 | 34 | 82.8% | 88.3% | 88.8% | ||
| 1993 | 34 | 74.5% | 84.7% | 94.1% | ||
| 1994 | 36 | 78.8% | 82.2% | 89.7% |
| Hover over boxplot or outliers for additional information |
| Chart generated 03/09/2018 |
| - Nickel, FIL, AA - |
| Lab: NWQL, PCode: 01065, MCode: CX010 |
| Login Dates: 10/14/86 through 05/08/89 |
| Open Data Set |
| Boxplot Description |
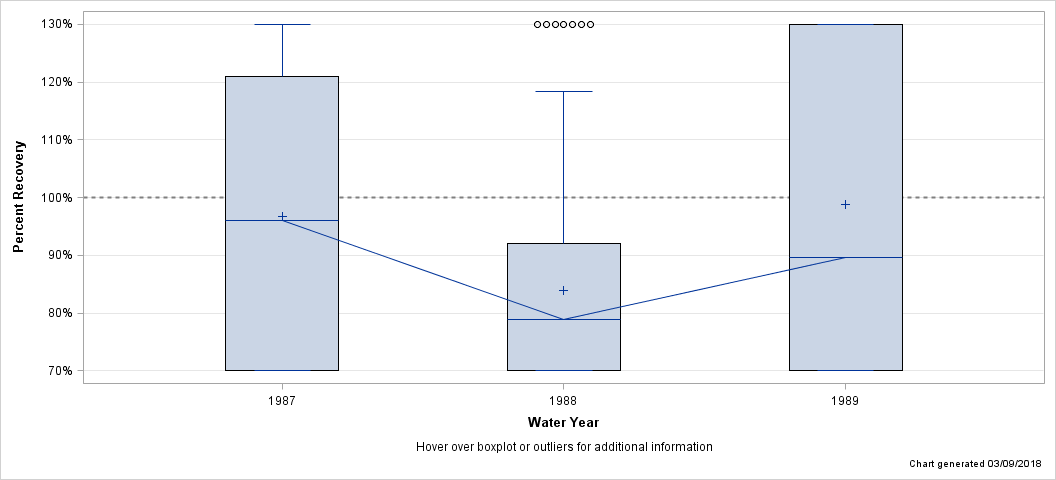
| Percent Recovery Statistics for Nickel, FIL, AA |
| Analyte | Parm-meth Code | Water Year | # of Samples |
25th Pctl | 50th Pctl (Median) |
75th Pctl |
|---|---|---|---|---|---|---|
| Nickel, FIL, AA | 01065CX010 | 1987 | 128 | 53.2% | 95.9% | 121.1% |
| 1988 | 126 | 58.8% | 78.9% | 92.1% | ||
| 1989 | 25 | 59.7% | 89.6% | 149.3% |
| Hover over boxplot or outliers for additional information |
| Chart generated 03/09/2018 |
| - Nickel, FIL, GFAA - |
| Lab: NWQL, PCode: 01065, MCode: GF090 |
| Login Dates: 05/15/89 through 09/19/01 |
| Open Data Set |
| Boxplot Description |
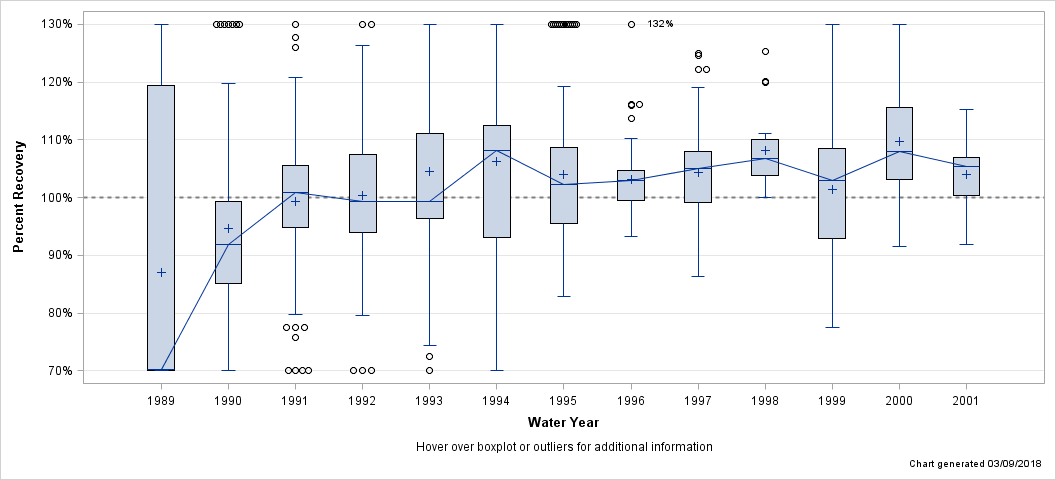
| Percent Recovery Statistics for Nickel, FIL, GFAA |
| Analyte | Parm-meth Code | Water Year | # of Samples |
25th Pctl | 50th Pctl (Median) |
75th Pctl |
|---|---|---|---|---|---|---|
| Nickel, FIL, GFAA | 01065GF090 | 1989 | 50 | 61.4% | 70.2% | 119.4% |
| 1990 | 216 | 85.1% | 92.0% | 99.4% | ||
| 1991 | 120 | 94.8% | 100.9% | 105.5% | ||
| 1992 | 127 | 94.0% | 99.4% | 107.4% | ||
| 1993 | 141 | 96.3% | 99.2% | 111.1% | ||
| 1994 | 121 | 93.0% | 108.1% | 112.5% | ||
| 1995 | 110 | 95.4% | 102.2% | 108.7% | ||
| 1996 | 87 | 99.5% | 102.9% | 104.7% | ||
| 1997 | 92 | 99.1% | 105.1% | 108.0% | ||
| 1998 | 24 | 103.8% | 106.7% | 110.0% | ||
| 1999 | 12 | 92.9% | 102.9% | 108.5% | ||
| 2000 | 12 | 103.2% | 108.0% | 115.7% | ||
| 2001 | 12 | 100.4% | 105.3% | 106.9% |
| Hover over boxplot or outliers for additional information |
| Chart generated 03/09/2018 |
| - Nickel, FIL, GFAA, LL - |
| Lab: NWQL, PCode: 01065, MCode: GF081 |
| Login Dates: 11/24/89 through 09/30/92 |
| Open Data Set |
| Boxplot Description |
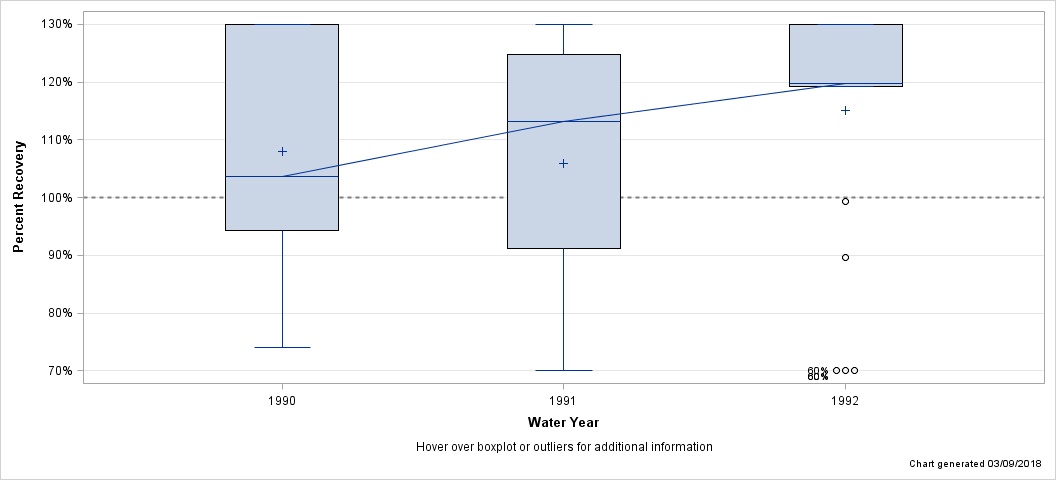
| Percent Recovery Statistics for Nickel, FIL, GFAA, LL |
| Analyte | Parm-meth Code | Water Year | # of Samples |
25th Pctl | 50th Pctl (Median) |
75th Pctl |
|---|---|---|---|---|---|---|
| Nickel, FIL, GFAA, LL | 01065GF081 | 1990 | 15 | 94.3% | 103.7% | 133.3% |
| 1991 | 20 | 91.2% | 113.2% | 125.8% | ||
| 1992 | 24 | 119.3% | 119.8% | 149.3% |
| Hover over boxplot or outliers for additional information |
| Chart generated 03/09/2018 |
| - Nickel, FIL, ICP-MS - |
| Lab: NWQL, PCode: 01065, MCode: PLM43 |
| Login Dates: 02/07/94 through 09/27/01 |
| Open Data Set |
| Boxplot Description |
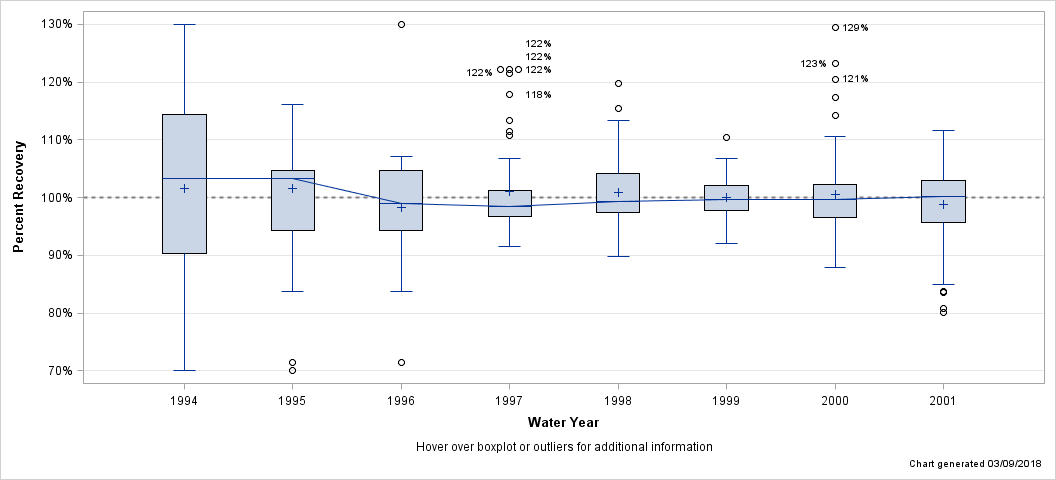
| Percent Recovery Statistics for Nickel, FIL, ICP-MS |
| Analyte | Parm-meth Code | Water Year | # of Samples |
25th Pctl | 50th Pctl (Median) |
75th Pctl |
|---|---|---|---|---|---|---|
| Nickel, FIL, ICP-MS | 01065PLM43 | 1994 | 32 | 90.3% | 103.2% | 114.4% |
| 1995 | 47 | 94.2% | 103.2% | 104.7% | ||
| 1996 | 46 | 94.2% | 99.0% | 104.7% | ||
| 1997 | 48 | 96.8% | 98.5% | 101.3% | ||
| 1998 | 96 | 97.4% | 99.3% | 104.1% | ||
| 1999 | 96 | 97.7% | 99.7% | 102.1% | ||
| 2000 | 72 | 96.5% | 99.7% | 102.3% | ||
| 2001 | 71 | 95.7% | 100.2% | 103.0% |
| Hover over boxplot or outliers for additional information |
| Chart generated 03/09/2018 |
| - Nickel, FIL, ICP-OES - |
| Lab: NWQL, PCode: 01065, MCode: PLA11 |
| Login Dates: 08/10/87 through 09/27/01 |
| Open Data Set |
| Boxplot Description |
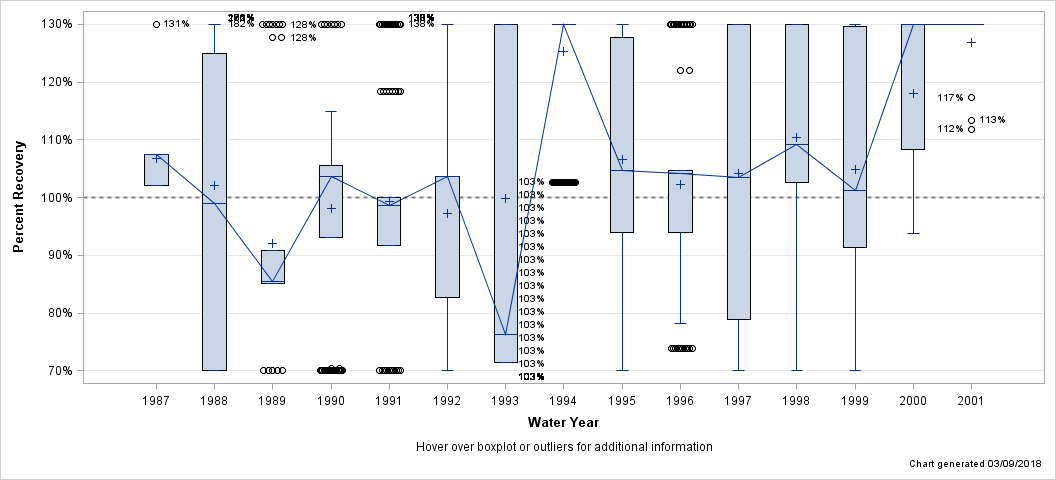
| Percent Recovery Statistics for Nickel, FIL, ICP-OES |
| Analyte | Parm-meth Code | Water Year | # of Samples |
25th Pctl | 50th Pctl (Median) |
75th Pctl |
|---|---|---|---|---|---|---|
| Nickel, FIL, ICP-OES | 01065PLA11 | 1987 | 20 | 102.0% | 107.5% | 107.5% |
| 1988 | 105 | 65.8% | 99.0% | 125.0% | ||
| 1989 | 62 | 85.1% | 85.5% | 90.9% | ||
| 1990 | 93 | 93.0% | 103.6% | 105.6% | ||
| 1991 | 156 | 91.7% | 98.6% | 100.0% | ||
| 1992 | 94 | 82.6% | 103.6% | 103.6% | ||
| 1993 | 132 | 71.4% | 76.3% | 245.7% | ||
| 1994 | 134 | 158.7% | 160.8% | 228.8% | ||
| 1995 | 135 | 93.9% | 104.7% | 127.8% | ||
| 1996 | 96 | 93.9% | 104.2% | 104.7% | ||
| 1997 | 96 | 78.8% | 103.5% | 134.2% | ||
| 1998 | 25 | 102.7% | 109.3% | 130.5% | ||
| 1999 | 28 | 91.3% | 101.3% | 130.6% | ||
| 2000 | 13 | 108.3% | 131.7% | 155.4% | ||
| 2001 | 15 | 146.4% | 333.3% | 1205% |
| Hover over boxplot or outliers for additional information |
| Chart generated 03/09/2018 |
| - Nickel, UNF, AA - |
| Lab: NWQL, PCode: 01067, MCode: CX019 |
| Login Dates: 10/14/86 through 04/27/89 |
| Open Data Set |
| Boxplot Description |
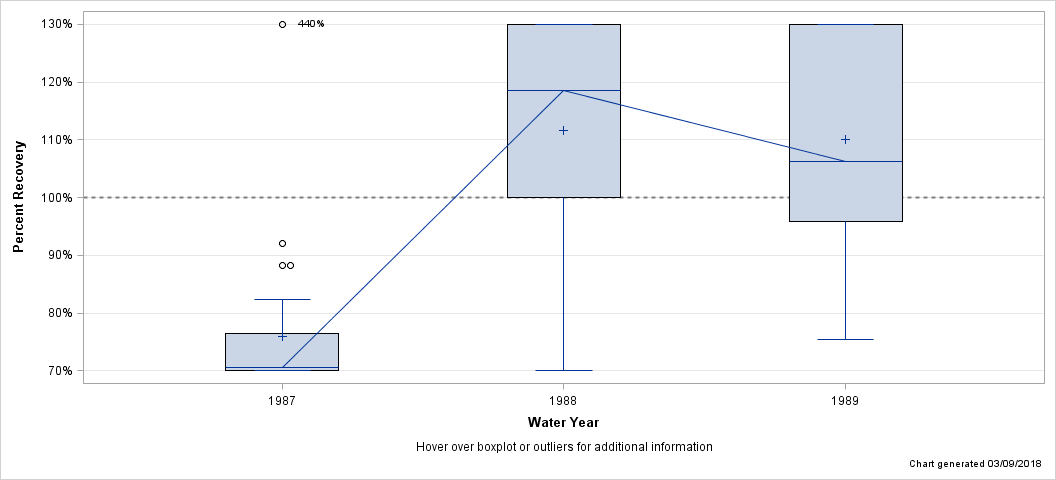
| Percent Recovery Statistics for Nickel, UNF, AA |
| Analyte | Parm-meth Code | Water Year | # of Samples |
25th Pctl | 50th Pctl (Median) |
75th Pctl |
|---|---|---|---|---|---|---|
| Nickel, UNF, AA | 01067CX019 | 1987 | 27 | 56.8% | 70.6% | 76.5% |
| 1988 | 46 | 100.0% | 118.5% | 136.4% | ||
| 1989 | 20 | 95.9% | 106.2% | 139.2% |
| Hover over boxplot or outliers for additional information |
| Chart generated 03/09/2018 |
| - Nickel, UNF, GFAA - |
| Lab: NWQL, PCode: 01067, MCode: GF101 |
| Login Dates: 05/08/89 through 09/24/01 |
| Open Data Set |
| Boxplot Description |
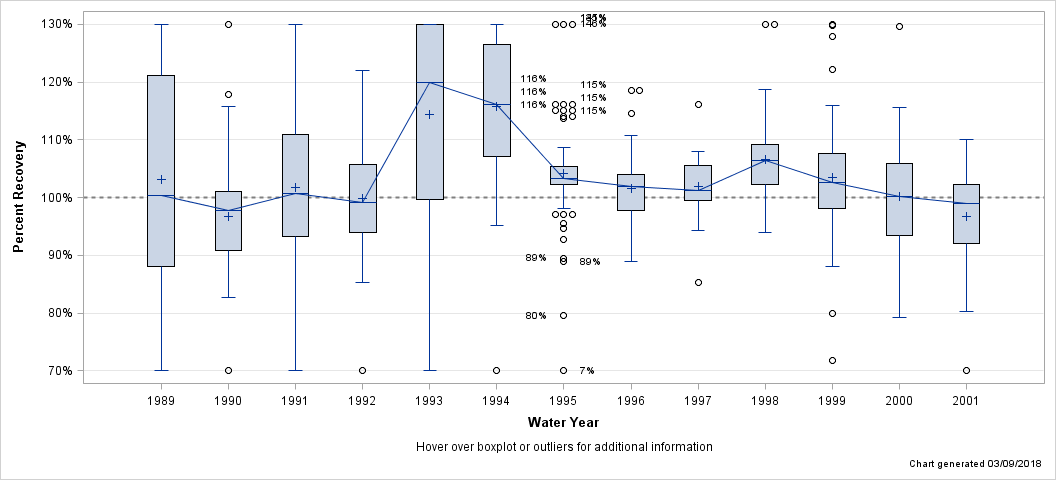
| Percent Recovery Statistics for Nickel, UNF, GFAA |
| Analyte | Parm-meth Code | Water Year | # of Samples |
25th Pctl | 50th Pctl (Median) |
75th Pctl |
|---|---|---|---|---|---|---|
| Nickel, UNF, GFAA | 01067GF101 | 1989 | 22 | 88.1% | 100.3% | 121.2% |
| 1990 | 65 | 90.9% | 97.7% | 101.0% | ||
| 1991 | 72 | 93.2% | 100.8% | 110.9% | ||
| 1992 | 67 | 94.0% | 99.2% | 105.7% | ||
| 1993 | 80 | 99.6% | 120.0% | 144.3% | ||
| 1994 | 59 | 107.1% | 116.1% | 126.6% | ||
| 1995 | 60 | 102.2% | 103.2% | 105.4% | ||
| 1996 | 44 | 97.8% | 102.0% | 103.9% | ||
| 1997 | 45 | 99.5% | 101.2% | 105.6% | ||
| 1998 | 48 | 102.3% | 106.4% | 109.3% | ||
| 1999 | 48 | 98.2% | 102.6% | 107.7% | ||
| 2000 | 35 | 93.5% | 100.1% | 105.9% | ||
| 2001 | 35 | 92.0% | 99.0% | 102.3% |
| Hover over boxplot or outliers for additional information |
| Chart generated 03/09/2018 |
| - Selenium, FIL, GFAA - |
| Lab: NWQL, PCode: 01145, MCode: GF091 |
| Login Dates: 10/05/98 through 09/28/01 |
| Open Data Set |
| Boxplot Description |
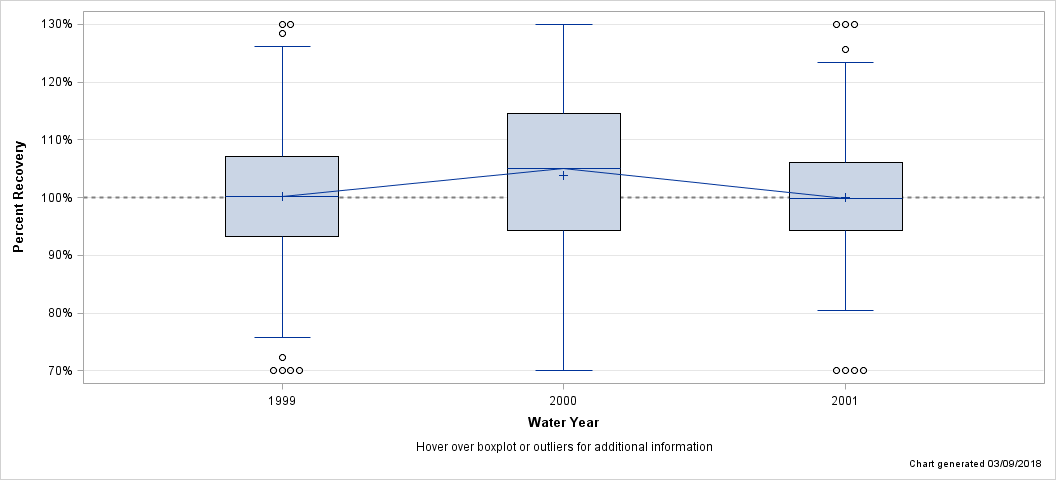
| Percent Recovery Statistics for Selenium, FIL, GFAA |
| Analyte | Parm-meth Code | Water Year | # of Samples |
25th Pctl | 50th Pctl (Median) |
75th Pctl |
|---|---|---|---|---|---|---|
| Selenium, FIL, GFAA | 01145GF091 | 1999 | 140 | 93.3% | 100.2% | 107.1% |
| 2000 | 132 | 94.4% | 105.0% | 114.5% | ||
| 2001 | 129 | 94.2% | 99.8% | 106.1% |
| Hover over boxplot or outliers for additional information |
| Chart generated 03/09/2018 |
| - Selenium, FIL, Hydride, AA - |
| Lab: NWQL, PCode: 01145, MCode: HY011 |
| Login Dates: 10/14/86 through 09/30/98 |
| Open Data Set |
| Boxplot Description |
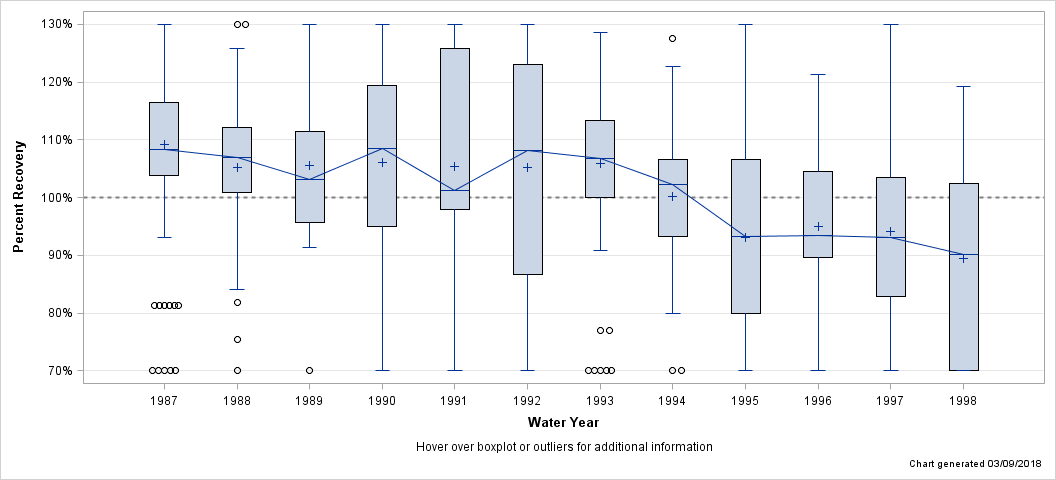
| Percent Recovery Statistics for Selenium, FIL, Hydride, AA |
| Analyte | Parm-meth Code | Water Year | # of Samples |
25th Pctl | 50th Pctl (Median) |
75th Pctl |
|---|---|---|---|---|---|---|
| Selenium, FIL, Hydride, AA | 01145HY011 | 1987 | 108 | 103.8% | 108.4% | 116.5% |
| 1988 | 103 | 100.8% | 106.9% | 112.1% | ||
| 1989 | 77 | 95.7% | 103.1% | 111.4% | ||
| 1990 | 111 | 95.0% | 108.5% | 119.4% | ||
| 1991 | 73 | 97.9% | 101.3% | 125.9% | ||
| 1992 | 95 | 86.7% | 108.1% | 123.1% | ||
| 1993 | 91 | 100.0% | 106.7% | 113.3% | ||
| 1994 | 72 | 93.2% | 102.2% | 106.5% | ||
| 1995 | 144 | 79.9% | 93.3% | 106.6% | ||
| 1996 | 109 | 89.6% | 93.5% | 104.5% | ||
| 1997 | 163 | 82.9% | 93.1% | 103.6% | ||
| 1998 | 108 | 68.7% | 90.1% | 102.5% |
| Hover over boxplot or outliers for additional information |
| Chart generated 03/09/2018 |
| - Selenium, UNF, EPA - |
| Lab: NWQL, PCode: 01147, MCode: GF031 |
| Login Dates: 10/30/97 through 09/18/00 |
| Open Data Set |
| Boxplot Description |
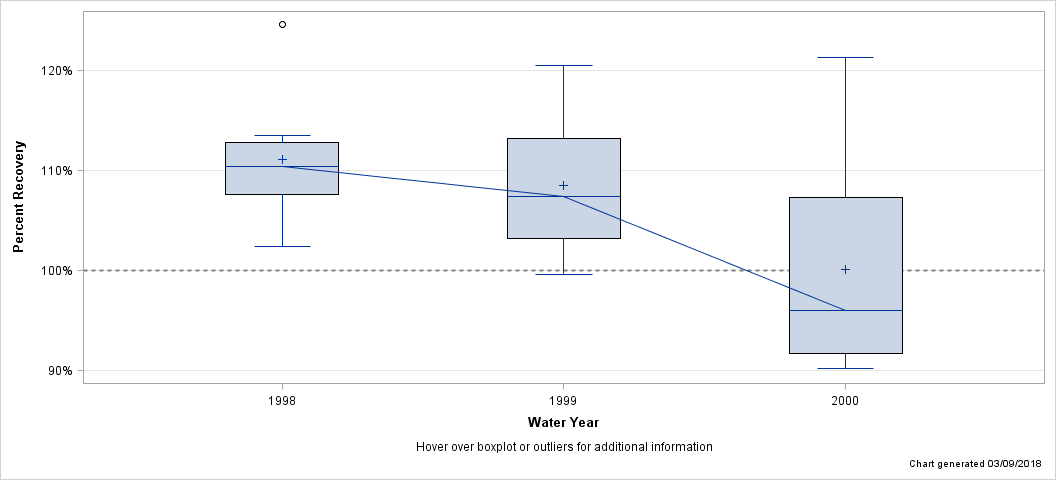
| Percent Recovery Statistics for Selenium, UNF, EPA |
| Analyte | Parm-meth Code | Water Year | # of Samples |
25th Pctl | 50th Pctl (Median) |
75th Pctl |
|---|---|---|---|---|---|---|
| Selenium, UNF, EPA | 01147GF031 | 1998 | 8 | 107.7% | 110.4% | 112.8% |
| 1999 | 8 | 103.2% | 107.5% | 113.2% | ||
| 2000 | 12 | 91.8% | 96.0% | 107.4% |
| Hover over boxplot or outliers for additional information |
| Chart generated 03/09/2018 |
| - Selenium, UNF, GFAA - |
| Lab: NWQL, PCode: 01147, MCode: GF102 |
| Login Dates: 10/09/98 through 09/24/01 |
| Open Data Set |
| Boxplot Description |
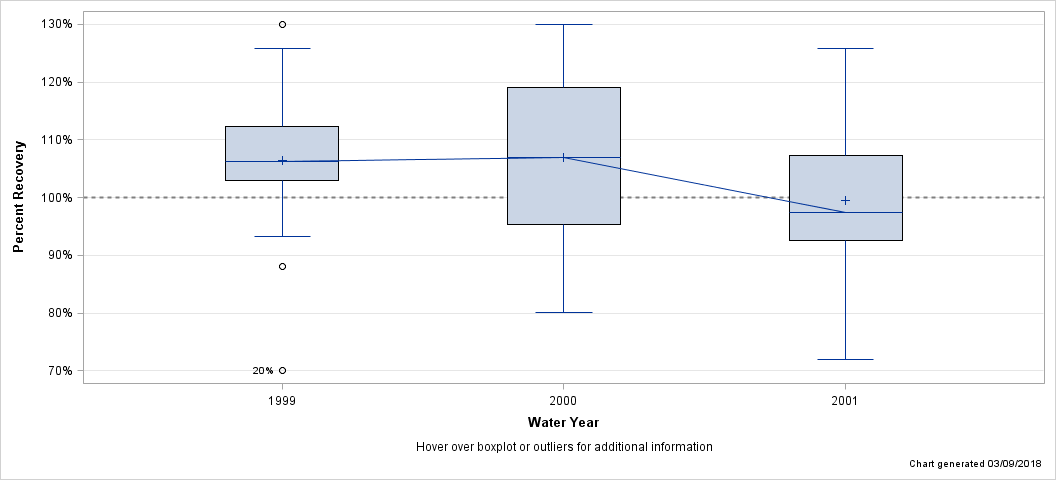
| Percent Recovery Statistics for Selenium, UNF, GFAA |
| Analyte | Parm-meth Code | Water Year | # of Samples |
25th Pctl | 50th Pctl (Median) |
75th Pctl |
|---|---|---|---|---|---|---|
| Selenium, UNF, GFAA | 01147GF102 | 1999 | 33 | 103.0% | 106.2% | 112.3% |
| 2000 | 35 | 95.4% | 107.0% | 119.1% | ||
| 2001 | 34 | 92.6% | 97.3% | 107.2% |
| Hover over boxplot or outliers for additional information |
| Chart generated 03/09/2018 |
| - Selenium, UNF, GFAA-EPA - |
| Lab: NWQL, PCode: 01147, MCode: GF073 |
| Login Dates: 05/17/91 through 09/19/97 |
| Open Data Set |
| Boxplot Description |
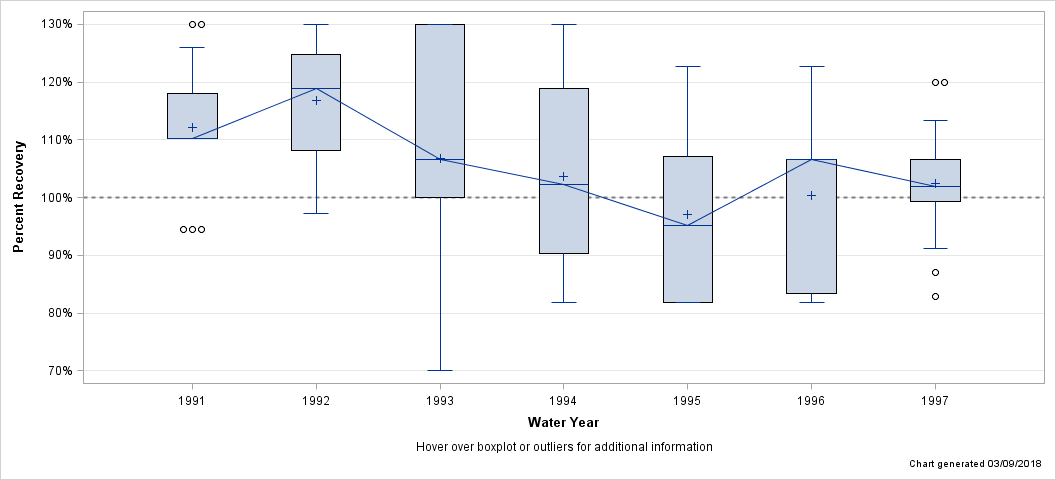
| Percent Recovery Statistics for Selenium, UNF, GFAA-EPA |
| Analyte | Parm-meth Code | Water Year | # of Samples |
25th Pctl | 50th Pctl (Median) |
75th Pctl |
|---|---|---|---|---|---|---|
| Selenium, UNF, GFAA-EPA | 01147GF073 | 1991 | 20 | 110.2% | 110.2% | 118.1% |
| 1992 | 24 | 108.1% | 118.9% | 124.9% | ||
| 1993 | 23 | 100.0% | 106.7% | 133.3% | ||
| 1994 | 24 | 90.3% | 102.2% | 118.8% | ||
| 1995 | 24 | 81.8% | 95.2% | 107.1% | ||
| 1996 | 11 | 83.4% | 106.7% | 106.7% | ||
| 1997 | 22 | 99.4% | 102.0% | 106.7% |
| Hover over boxplot or outliers for additional information |
| Chart generated 03/09/2018 |
| - Selenium, UNF, Hydride, AA - |
| Lab: NWQL, PCode: 01147, MCode: HY012 |
| Login Dates: 11/12/86 through 09/24/98 |
| Open Data Set |
| Boxplot Description |
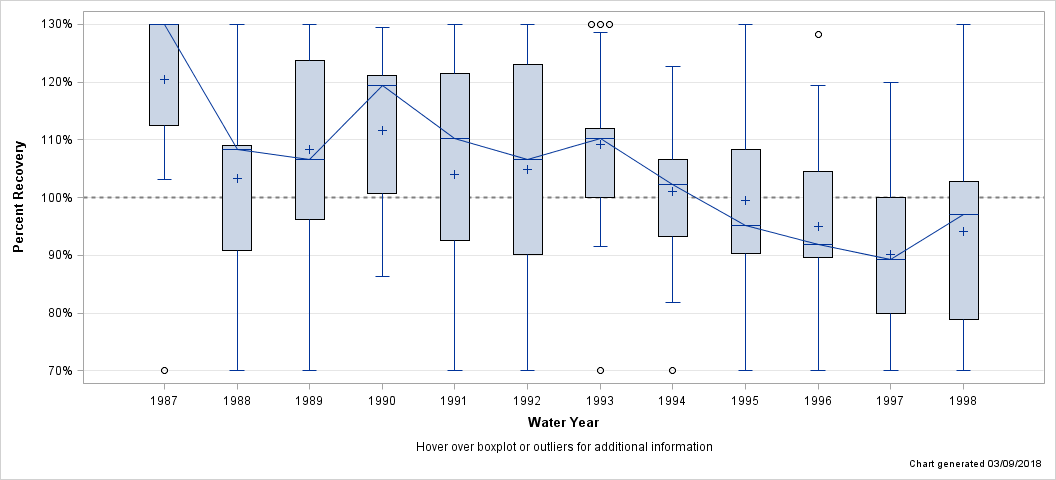
| Percent Recovery Statistics for Selenium, UNF, Hydride, AA |
| Analyte | Parm-meth Code | Water Year | # of Samples |
25th Pctl | 50th Pctl (Median) |
75th Pctl |
|---|---|---|---|---|---|---|
| Selenium, UNF, Hydride, AA | 01147HY012 | 1987 | 25 | 112.5% | 130.4% | 154.6% |
| 1988 | 46 | 90.9% | 108.4% | 109.1% | ||
| 1989 | 42 | 96.2% | 106.7% | 123.8% | ||
| 1990 | 75 | 100.7% | 119.4% | 121.2% | ||
| 1991 | 66 | 92.6% | 110.2% | 121.5% | ||
| 1992 | 82 | 90.1% | 106.7% | 123.1% | ||
| 1993 | 80 | 100.0% | 110.3% | 111.9% | ||
| 1994 | 60 | 93.2% | 102.2% | 106.5% | ||
| 1995 | 57 | 90.3% | 95.2% | 108.4% | ||
| 1996 | 44 | 89.6% | 91.9% | 104.5% | ||
| 1997 | 45 | 80.0% | 89.2% | 100.0% | ||
| 1998 | 40 | 78.9% | 97.0% | 102.8% |
| Hover over boxplot or outliers for additional information |
| Chart generated 03/09/2018 |
| - Silver, FIL, AA - |
| Lab: NWQL, PCode: 01075, MCode: CX011 |
| Login Dates: 10/14/86 through 05/08/89 |
| Open Data Set |
| Boxplot Description |
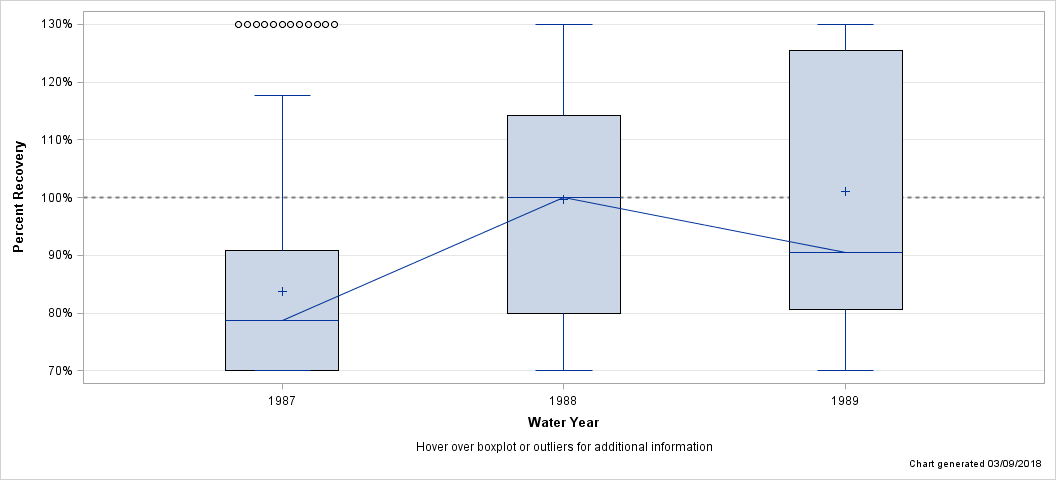
| Percent Recovery Statistics for Silver, FIL, AA |
| Analyte | Parm-meth Code | Water Year | # of Samples |
25th Pctl | 50th Pctl (Median) |
75th Pctl |
|---|---|---|---|---|---|---|
| Silver, FIL, AA | 01075CX011 | 1987 | 110 | 53.2% | 78.7% | 90.9% |
| 1988 | 103 | 80.0% | 100.0% | 114.3% | ||
| 1989 | 32 | 80.6% | 90.5% | 128.4% |
| Hover over boxplot or outliers for additional information |
| Chart generated 03/09/2018 |
| - Silver, FIL, GFAA - |
| Lab: NWQL, PCode: 01075, MCode: GF092 |
| Login Dates: 05/12/89 through 09/24/01 |
| Open Data Set |
| Boxplot Description |
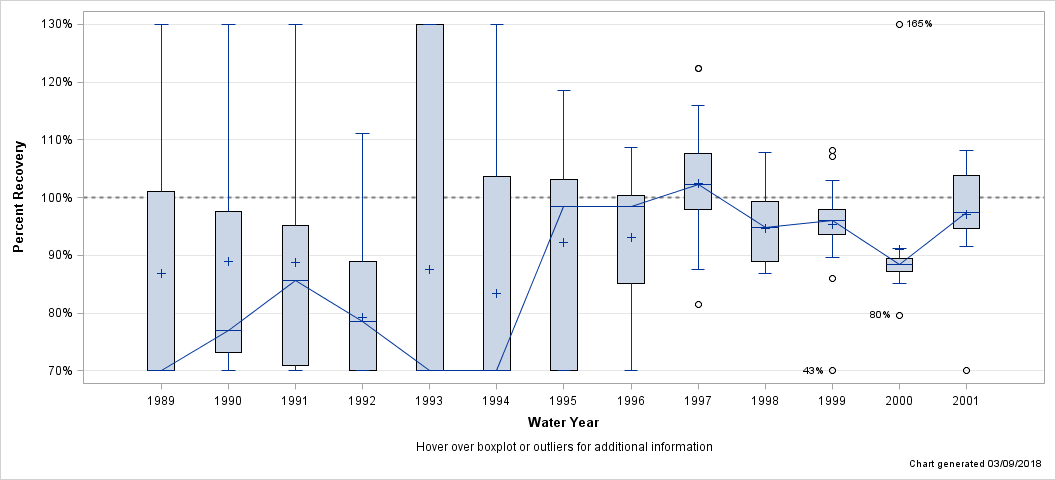
| Percent Recovery Statistics for Silver, FIL, GFAA |
| Analyte | Parm-meth Code | Water Year | # of Samples |
25th Pctl | 50th Pctl (Median) |
75th Pctl |
|---|---|---|---|---|---|---|
| Silver, FIL, GFAA | 01075GF092 | 1989 | 44 | 47.5% | 67.7% | 101.0% |
| 1990 | 148 | 73.2% | 76.9% | 97.6% | ||
| 1991 | 63 | 70.9% | 85.7% | 95.2% | ||
| 1992 | 48 | 60.6% | 78.5% | 88.9% | ||
| 1993 | 48 | 60.6% | 69.0% | 165.8% | ||
| 1994 | 85 | 60.6% | 63.7% | 103.6% | ||
| 1995 | 96 | 53.8% | 98.4% | 103.1% | ||
| 1996 | 81 | 85.0% | 98.4% | 100.3% | ||
| 1997 | 69 | 97.9% | 102.3% | 107.6% | ||
| 1998 | 16 | 88.9% | 94.8% | 99.3% | ||
| 1999 | 24 | 93.6% | 96.0% | 98.0% | ||
| 2000 | 12 | 87.2% | 88.5% | 89.4% | ||
| 2001 | 12 | 94.7% | 97.4% | 103.9% |
| Hover over boxplot or outliers for additional information |
| Chart generated 03/09/2018 |
| - Silver, FIL, GFAA, LL - |
| Lab: NWQL, PCode: 01075, MCode: GF093 |
| Login Dates: 10/07/98 through 08/09/00 |
| Open Data Set |
| Boxplot Description |
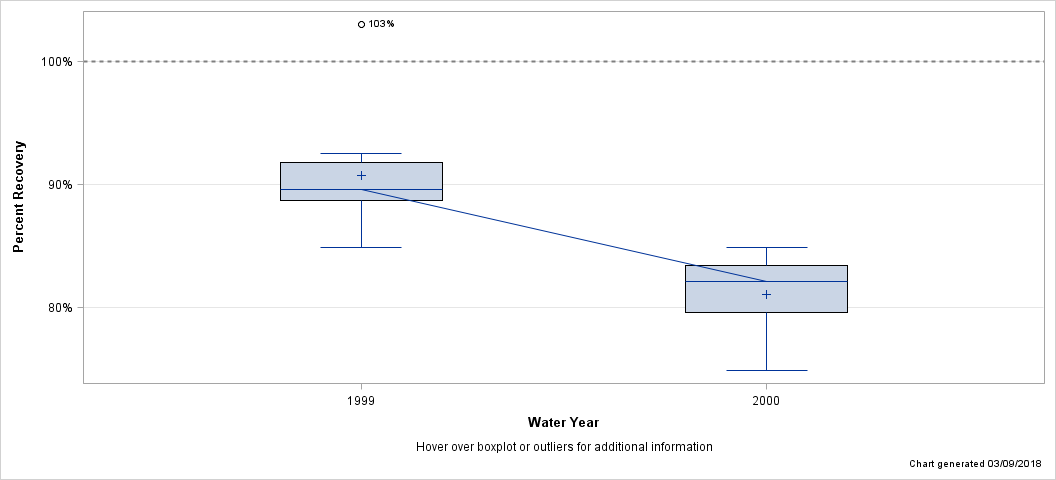
| Percent Recovery Statistics for Silver, FIL, GFAA, LL |
| Analyte | Parm-meth Code | Water Year | # of Samples |
25th Pctl | 50th Pctl (Median) |
75th Pctl |
|---|---|---|---|---|---|---|
| Silver, FIL, GFAA, LL | 01075GF093 | 1999 | 12 | 88.7% | 89.7% | 91.8% |
| 2000 | 11 | 79.6% | 82.2% | 83.5% |
| Hover over boxplot or outliers for additional information |
| Chart generated 03/09/2018 |
| - Silver, FIL, ICP-MS - |
| Lab: NWQL, PCode: 01075, MCode: PLM43 |
| Login Dates: 02/07/94 through 08/28/01 |
| Open Data Set |
| Boxplot Description |
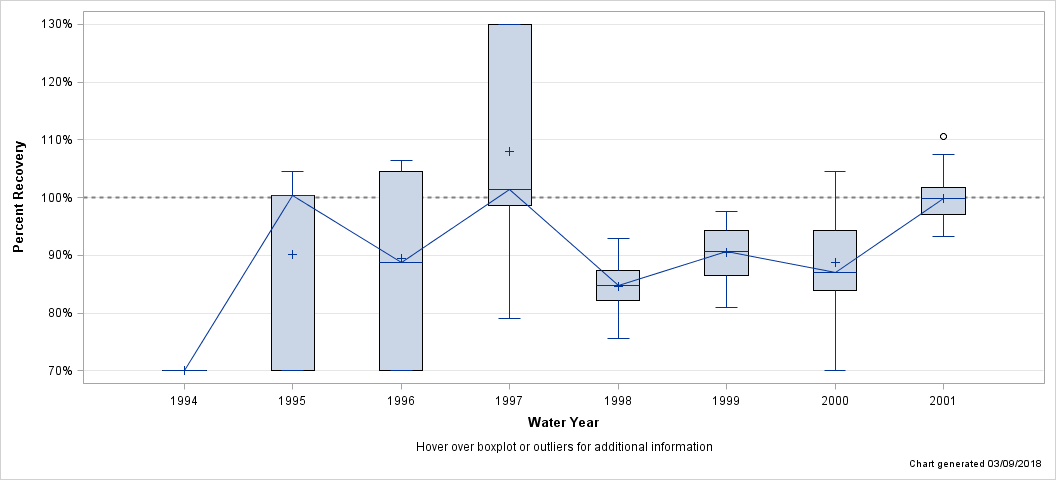
| Percent Recovery Statistics for Silver, FIL, ICP-MS |
| Analyte | Parm-meth Code | Water Year | # of Samples |
25th Pctl | 50th Pctl (Median) |
75th Pctl |
|---|---|---|---|---|---|---|
| Silver, FIL, ICP-MS | 01075PLM43 | 1994 | 32 | 38.0% | 40.2% | 63.7% |
| 1995 | 47 | 38.0% | 100.3% | 100.3% | ||
| 1996 | 46 | 66.9% | 88.7% | 104.5% | ||
| 1997 | 48 | 98.7% | 101.4% | 177.0% | ||
| 1998 | 64 | 82.2% | 84.8% | 87.4% | ||
| 1999 | 82 | 86.5% | 90.7% | 94.4% | ||
| 2000 | 36 | 83.8% | 87.0% | 94.3% | ||
| 2001 | 47 | 97.0% | 99.9% | 101.7% |
| Hover over boxplot or outliers for additional information |
| Chart generated 03/09/2018 |
| - Silver, FIL, ICP-OES - |
| Lab: NWQL, PCode: 01075, MCode: PLA11 |
| Login Dates: 08/10/87 through 08/23/01 |
| Open Data Set |
| Boxplot Description |
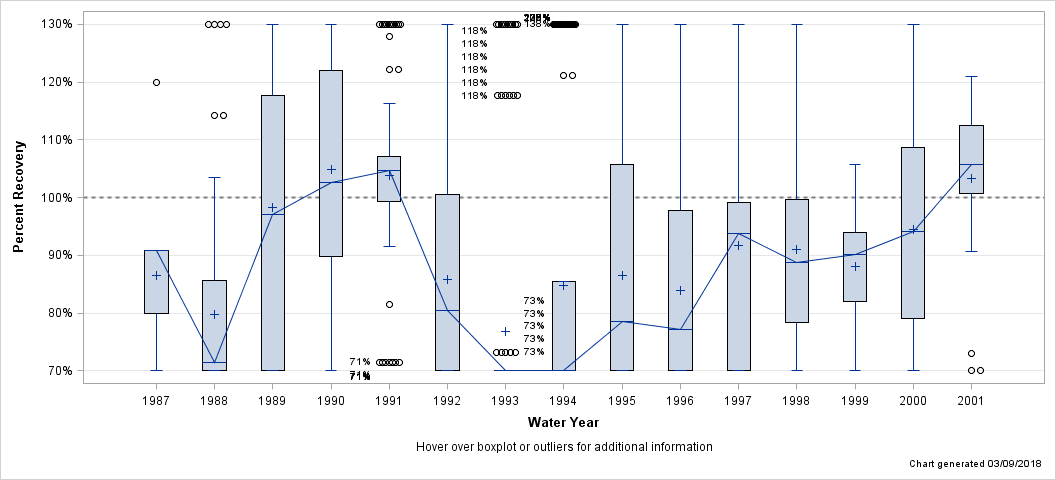
| Percent Recovery Statistics for Silver, FIL, ICP-OES |
| Analyte | Parm-meth Code | Water Year | # of Samples |
25th Pctl | 50th Pctl (Median) |
75th Pctl |
|---|---|---|---|---|---|---|
| Silver, FIL, ICP-OES | 01075PLA11 | 1987 | 20 | 80.0% | 90.9% | 90.9% |
| 1988 | 105 | 36.4% | 71.4% | 85.7% | ||
| 1989 | 62 | 67.2% | 97.1% | 117.6% | ||
| 1990 | 94 | 89.7% | 102.6% | 122.0% | ||
| 1991 | 157 | 99.2% | 104.7% | 107.1% | ||
| 1992 | 133 | 48.8% | 80.5% | 100.6% | ||
| 1993 | 132 | 48.8% | 58.8% | 69.0% | ||
| 1994 | 134 | 42.2% | 63.7% | 85.5% | ||
| 1995 | 135 | 39.3% | 78.6% | 105.8% | ||
| 1996 | 96 | 58.7% | 77.1% | 97.7% | ||
| 1997 | 96 | 68.4% | 93.7% | 99.2% | ||
| 1998 | 27 | 78.3% | 88.8% | 99.7% | ||
| 1999 | 35 | 82.1% | 90.2% | 94.0% | ||
| 2000 | 26 | 79.0% | 94.2% | 108.7% | ||
| 2001 | 24 | 100.8% | 105.7% | 112.4% |
| Hover over boxplot or outliers for additional information |
| Chart generated 03/09/2018 |
| - Silver, UNF, AA - |
| Lab: NWQL, PCode: 01077, MCode: CX020 |
| Login Dates: 10/14/86 through 04/27/89 |
| Open Data Set |
| Boxplot Description |
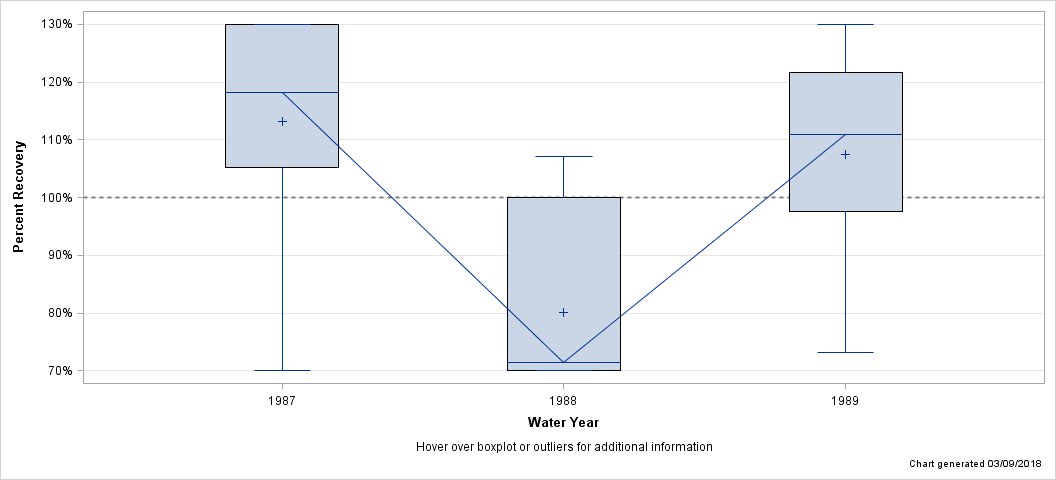
| Percent Recovery Statistics for Silver, UNF, AA |
| Analyte | Parm-meth Code | Water Year | # of Samples |
25th Pctl | 50th Pctl (Median) |
75th Pctl |
|---|---|---|---|---|---|---|
| Silver, UNF, AA | 01077CX020 | 1987 | 27 | 105.3% | 118.2% | 135.7% |
| 1988 | 46 | 58.8% | 71.4% | 100.0% | ||
| 1989 | 20 | 97.6% | 111.0% | 121.7% |
| Hover over boxplot or outliers for additional information |
| Chart generated 03/09/2018 |
| - Silver, UNF, GFAA - |
| Lab: NWQL, PCode: 01077, MCode: GF103 |
| Login Dates: 05/08/89 through 09/24/01 |
| Open Data Set |
| Boxplot Description |
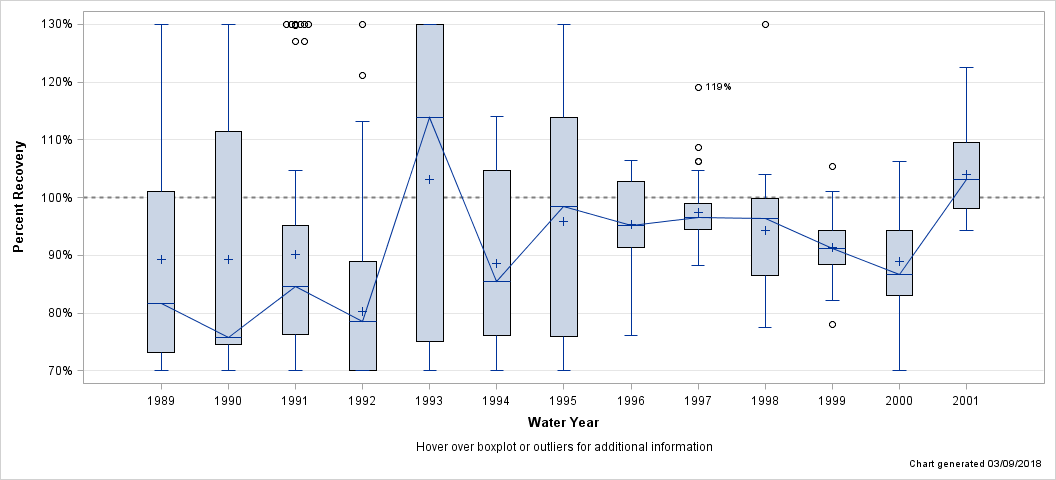
| Percent Recovery Statistics for Silver, UNF, GFAA |
| Analyte | Parm-meth Code | Water Year | # of Samples |
25th Pctl | 50th Pctl (Median) |
75th Pctl |
|---|---|---|---|---|---|---|
| Silver, UNF, GFAA | 01077GF103 | 1989 | 22 | 73.2% | 81.6% | 101.0% |
| 1990 | 68 | 74.6% | 75.8% | 122.3% | ||
| 1991 | 61 | 76.3% | 84.7% | 95.2% | ||
| 1992 | 82 | 66.7% | 78.5% | 88.9% | ||
| 1993 | 80 | 74.5% | 113.9% | 142.9% | ||
| 1994 | 60 | 76.0% | 85.5% | 104.7% | ||
| 1995 | 60 | 75.9% | 98.4% | 113.9% | ||
| 1996 | 44 | 91.3% | 95.1% | 102.8% | ||
| 1997 | 45 | 94.5% | 96.6% | 98.9% | ||
| 1998 | 32 | 86.6% | 96.4% | 99.8% | ||
| 1999 | 48 | 88.5% | 91.3% | 94.3% | ||
| 2000 | 31 | 82.9% | 86.6% | 94.3% | ||
| 2001 | 31 | 98.1% | 103.2% | 109.5% |
| Hover over boxplot or outliers for additional information |
| Chart generated 03/09/2018 |
| - Strontium, FIL, AA - |
| Lab: NWQL, PCode: 01080, MCode: AA038 |
| Login Dates: 01/11/90 through 03/27/96 |
| Open Data Set |
| Boxplot Description |
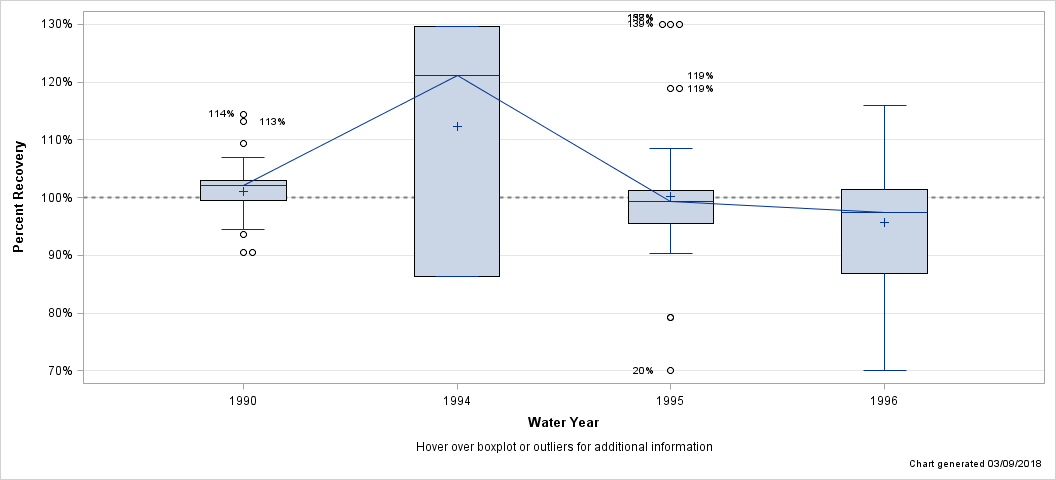
| Percent Recovery Statistics for Strontium, FIL, AA |
| Analyte | Parm-meth Code | Water Year | # of Samples |
25th Pctl | 50th Pctl (Median) |
75th Pctl |
|---|---|---|---|---|---|---|
| Strontium, FIL, AA | 01080AA038 | 1990 | 55 | 99.5% | 102.0% | 102.9% |
| 1994 | 3 | 86.4% | 121.2% | 129.6% | ||
| 1995 | 36 | 95.5% | 99.2% | 101.2% | ||
| 1996 | 11 | 86.9% | 97.3% | 101.3% |
| Hover over boxplot or outliers for additional information |
| Chart generated 03/09/2018 |
| - Strontium, FIL, ICP-OES - |
| Lab: NWQL, PCode: 01080, MCode: PLA11 |
| Login Dates: 10/14/86 through 09/27/01 |
| Open Data Set |
| Boxplot Description |
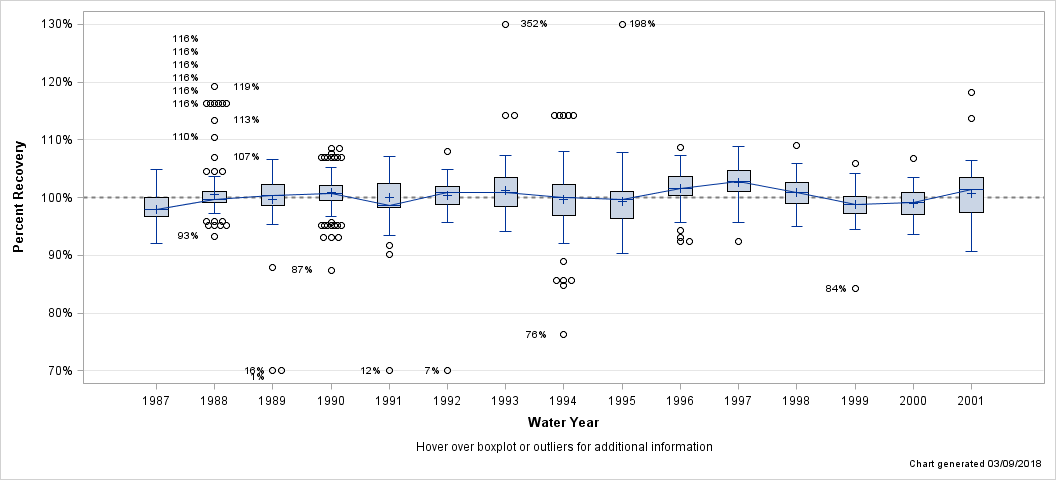
| Percent Recovery Statistics for Strontium, FIL, ICP-OES |
| Analyte | Parm-meth Code | Water Year | # of Samples |
25th Pctl | 50th Pctl (Median) |
75th Pctl |
|---|---|---|---|---|---|---|
| Strontium, FIL, ICP-OES | 01080PLA11 | 1987 | 163 | 96.7% | 97.9% | 100.0% |
| 1988 | 186 | 99.2% | 99.7% | 101.0% | ||
| 1989 | 123 | 98.6% | 100.4% | 102.3% | ||
| 1990 | 129 | 99.5% | 100.8% | 102.0% | ||
| 1991 | 192 | 98.2% | 98.7% | 102.5% | ||
| 1992 | 74 | 98.9% | 100.8% | 101.9% | ||
| 1993 | 114 | 98.5% | 100.9% | 103.5% | ||
| 1994 | 156 | 97.0% | 100.0% | 102.2% | ||
| 1995 | 135 | 96.3% | 99.7% | 101.0% | ||
| 1996 | 108 | 100.4% | 101.5% | 103.6% | ||
| 1997 | 117 | 101.1% | 102.8% | 104.7% | ||
| 1998 | 96 | 99.0% | 100.9% | 102.5% | ||
| 1999 | 93 | 97.3% | 98.8% | 100.2% | ||
| 2000 | 60 | 97.0% | 99.2% | 100.9% | ||
| 2001 | 60 | 97.5% | 101.3% | 103.5% |
| Hover over boxplot or outliers for additional information |
| Chart generated 03/09/2018 |
| - Strontium, UNF, AA - |
| Lab: NWQL, PCode: 01082, MCode: AA070 |
| Login Dates: 10/13/98 through 03/15/99 |
| Open Data Set |
| Boxplot Description |
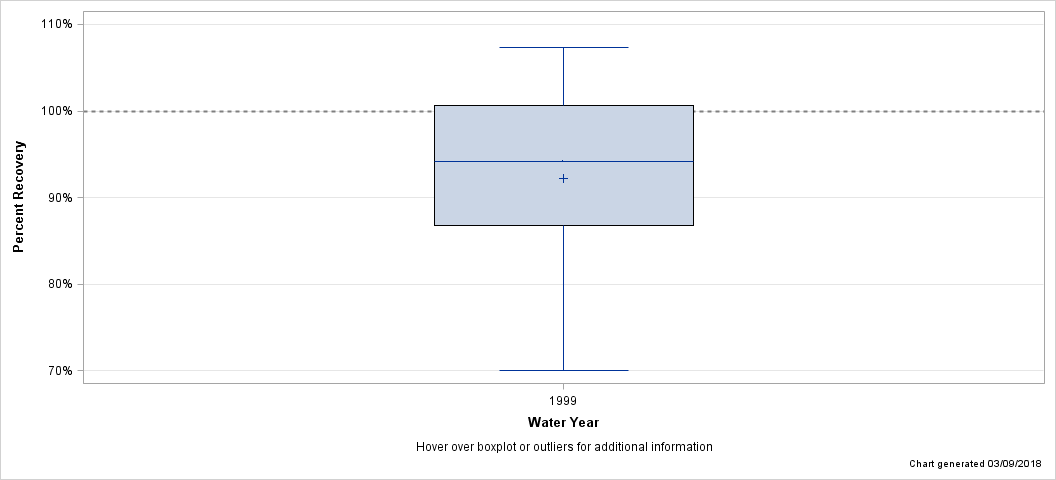
| Percent Recovery Statistics for Strontium, UNF, AA |
| Analyte | Parm-meth Code | Water Year | # of Samples |
25th Pctl | 50th Pctl (Median) |
75th Pctl |
|---|---|---|---|---|---|---|
| Strontium, UNF, AA | 01082AA070 | 1999 | 6 | 86.8% | 94.2% | 100.7% |
| Hover over boxplot or outliers for additional information |
| Chart generated 03/09/2018 |
| - Strontium, UNF, ICP-OES - |
| Lab: NWQL, PCode: 01082, MCode: PLA15 |
| Login Dates: 05/17/99 through 09/14/01 |
| Open Data Set |
| Boxplot Description |
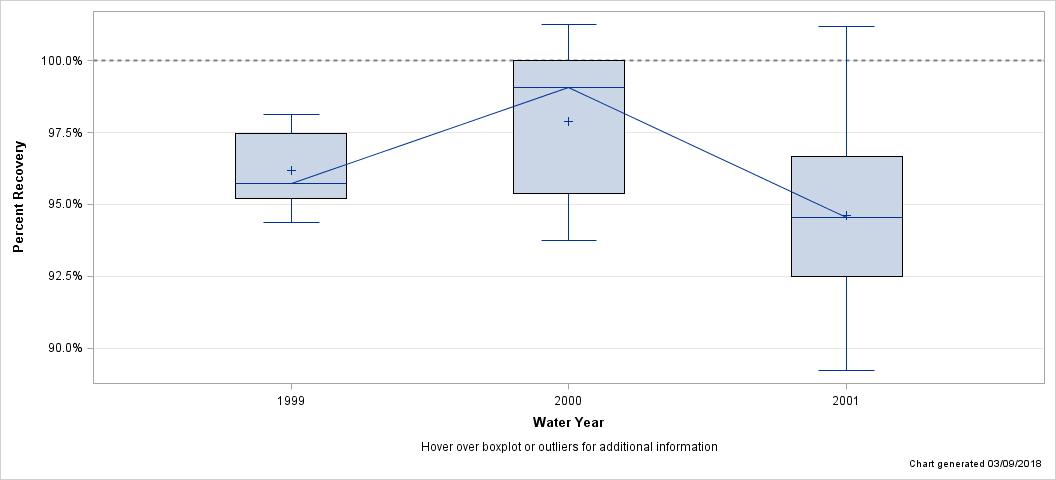
| Percent Recovery Statistics for Strontium, UNF, ICP-OES |
| Analyte | Parm-meth Code | Water Year | # of Samples |
25th Pctl | 50th Pctl (Median) |
75th Pctl |
|---|---|---|---|---|---|---|
| Strontium, UNF, ICP-OES | 01082PLA15 | 1999 | 5 | 95.2% | 95.7% | 97.5% |
| 2000 | 11 | 95.4% | 99.1% | 100.0% | ||
| 2001 | 12 | 92.5% | 94.5% | 96.7% |
| Hover over boxplot or outliers for additional information |
| Chart generated 03/09/2018 |
| - Thallium, FIL, GFAA, LL - |
| Lab: NWQL, PCode: 01057, MCode: GF083 |
| Login Dates: 10/07/98 through 09/08/99 |
| Open Data Set |
| Boxplot Description |
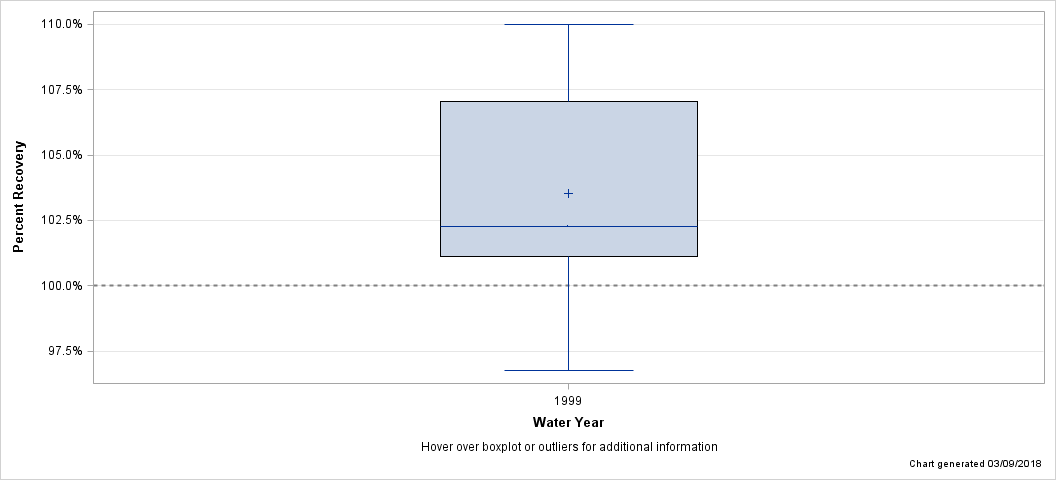
| Percent Recovery Statistics for Thallium, FIL, GFAA, LL |
| Analyte | Parm-meth Code | Water Year | # of Samples |
25th Pctl | 50th Pctl (Median) |
75th Pctl |
|---|---|---|---|---|---|---|
| Thallium, FIL, GFAA, LL | 01057GF083 | 1999 | 12 | 101.1% | 102.3% | 107.0% |
| Hover over boxplot or outliers for additional information |
| Chart generated 03/09/2018 |
| - Vanadium, FIL, COL - |
| Lab: NWQL, PCode: 01085, MCode: CL067 |
| Login Dates: 10/04/89 through 12/28/99 |
| Open Data Set |
| Boxplot Description |
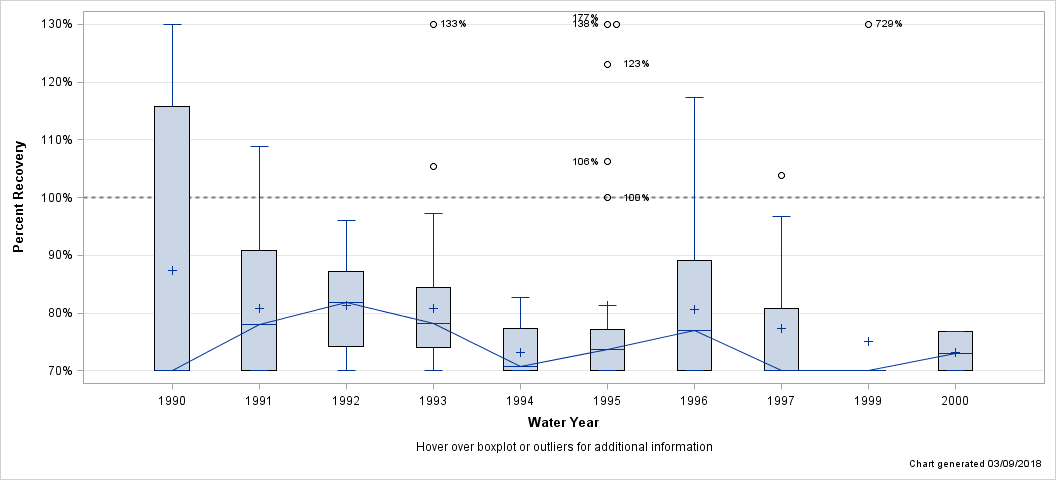
| Percent Recovery Statistics for Vanadium, FIL, COL |
| Analyte | Parm-meth Code | Water Year | # of Samples |
25th Pctl | 50th Pctl (Median) |
75th Pctl |
|---|---|---|---|---|---|---|
| Vanadium, FIL, COL | 01085CL067 | 1990 | 57 | 43.5% | 65.2% | 115.8% |
| 1991 | 84 | 54.8% | 78.1% | 90.9% | ||
| 1992 | 72 | 74.2% | 81.8% | 87.3% | ||
| 1993 | 48 | 74.1% | 78.2% | 84.5% | ||
| 1994 | 23 | 65.5% | 70.8% | 77.3% | ||
| 1995 | 27 | 59.6% | 73.7% | 77.2% | ||
| 1996 | 28 | 65.9% | 76.9% | 89.1% | ||
| 1997 | 21 | 61.1% | 64.9% | 80.8% | ||
| 1999 | 12 | 35.6% | 35.6% | 35.6% | ||
| 2000 | 3 | 69.7% | 73.0% | 76.7% |
| Hover over boxplot or outliers for additional information |
| Chart generated 03/09/2018 |
| - Vanadium, FIL, ICP-MS - |
| Lab: NWQL, PCode: 01085, MCode: PLM40 |
| Login Dates: 01/11/00 through 09/27/01 |
| Open Data Set |
| Boxplot Description |
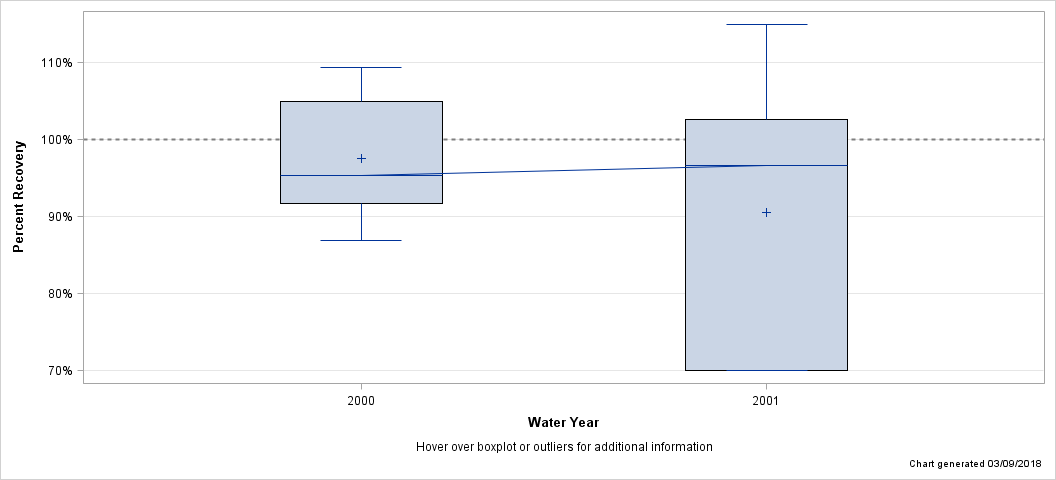
| Percent Recovery Statistics for Vanadium, FIL, ICP-MS |
| Analyte | Parm-meth Code | Water Year | # of Samples |
25th Pctl | 50th Pctl (Median) |
75th Pctl |
|---|---|---|---|---|---|---|
| Vanadium, FIL, ICP-MS | 01085PLM40 | 2000 | 11 | 91.7% | 95.3% | 105.0% |
| 2001 | 48 | 42.9% | 96.7% | 102.7% |
| Hover over boxplot or outliers for additional information |
| Chart generated 03/09/2018 |
| - Vanadium, FIL, ICP-OES - |
| Lab: NWQL, PCode: 01085, MCode: PLA11 |
| Login Dates: 10/17/88 through 09/27/01 |
| Open Data Set |
| Boxplot Description |
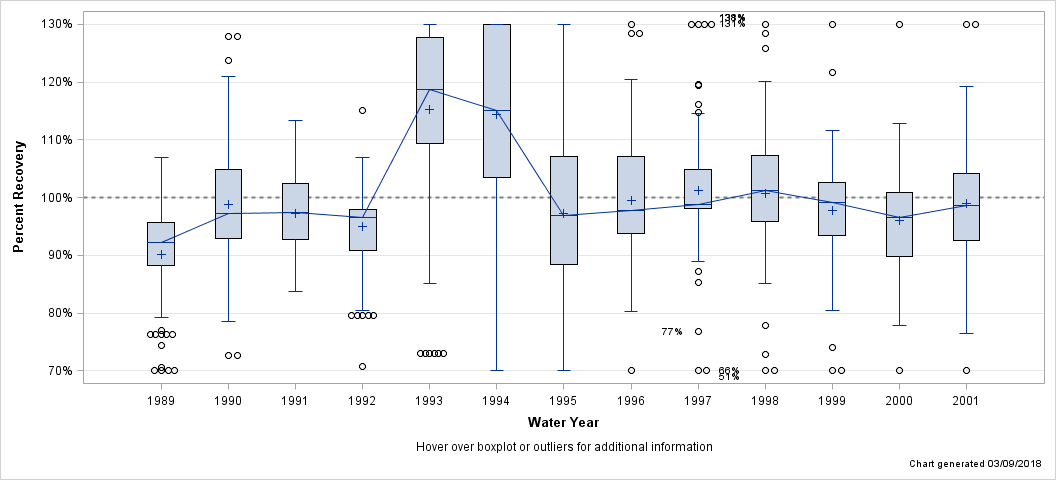
| Percent Recovery Statistics for Vanadium, FIL, ICP-OES |
| Analyte | Parm-meth Code | Water Year | # of Samples |
25th Pctl | 50th Pctl (Median) |
75th Pctl |
|---|---|---|---|---|---|---|
| Vanadium, FIL, ICP-OES | 01085PLA11 | 1989 | 123 | 88.2% | 92.3% | 95.7% |
| 1990 | 128 | 92.9% | 97.3% | 104.8% | ||
| 1991 | 192 | 92.7% | 97.4% | 102.4% | ||
| 1992 | 133 | 90.9% | 96.6% | 97.9% | ||
| 1993 | 132 | 109.4% | 118.8% | 127.7% | ||
| 1994 | 134 | 103.6% | 115.1% | 193.5% | ||
| 1995 | 135 | 88.3% | 96.9% | 107.1% | ||
| 1996 | 96 | 93.7% | 97.7% | 107.1% | ||
| 1997 | 96 | 98.2% | 98.8% | 104.8% | ||
| 1998 | 51 | 95.9% | 101.2% | 107.3% | ||
| 1999 | 69 | 93.4% | 99.1% | 102.7% | ||
| 2000 | 36 | 89.7% | 96.6% | 101.0% | ||
| 2001 | 37 | 92.6% | 98.7% | 104.2% |
| Hover over boxplot or outliers for additional information |
| Chart generated 03/09/2018 |
| - Zinc, FIL, AA - |
| Lab: NWQL, PCode: 01090, MCode: AA039 |
| Login Dates: 10/14/86 through 03/27/96 |
| Open Data Set |
| Boxplot Description |
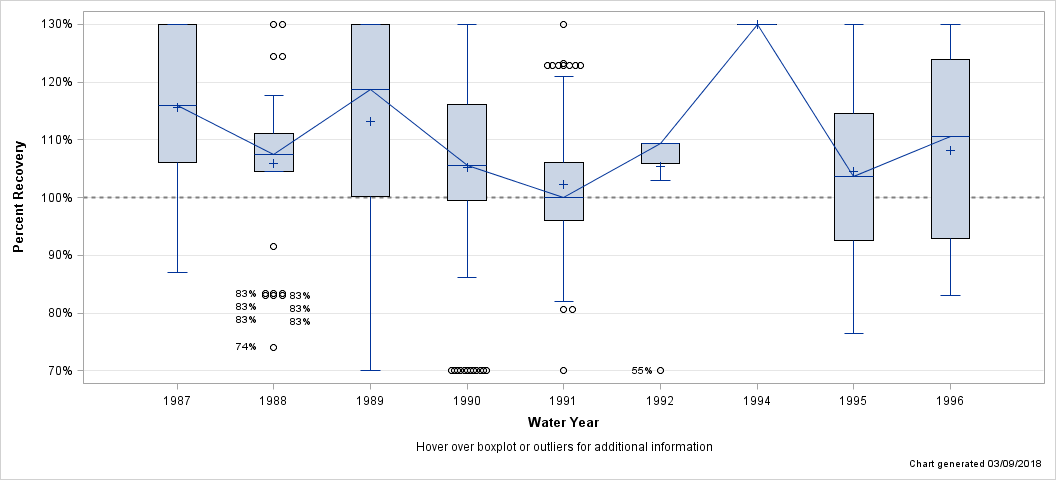
| Percent Recovery Statistics for Zinc, FIL, AA |
| Analyte | Parm-meth Code | Water Year | # of Samples |
25th Pctl | 50th Pctl (Median) |
75th Pctl |
|---|---|---|---|---|---|---|
| Zinc, FIL, AA | 01090AA039 | 1987 | 34 | 106.1% | 115.9% | 144.9% |
| 1988 | 45 | 104.6% | 107.5% | 111.1% | ||
| 1989 | 74 | 100.2% | 118.8% | 150.4% | ||
| 1990 | 179 | 99.5% | 105.5% | 116.1% | ||
| 1991 | 85 | 96.0% | 100.0% | 106.1% | ||
| 1992 | 16 | 105.9% | 109.3% | 109.3% | ||
| 1994 | 3 | 148.1% | 166.7% | 166.7% | ||
| 1995 | 35 | 92.6% | 103.6% | 114.6% | ||
| 1996 | 11 | 92.9% | 110.7% | 123.9% |
| Hover over boxplot or outliers for additional information |
| Chart generated 03/09/2018 |
| - Zinc, FIL, ICP-MS - |
| Lab: NWQL, PCode: 01090, MCode: PLM43 |
| Login Dates: 02/07/94 through 09/27/01 |
| Open Data Set |
| Boxplot Description |
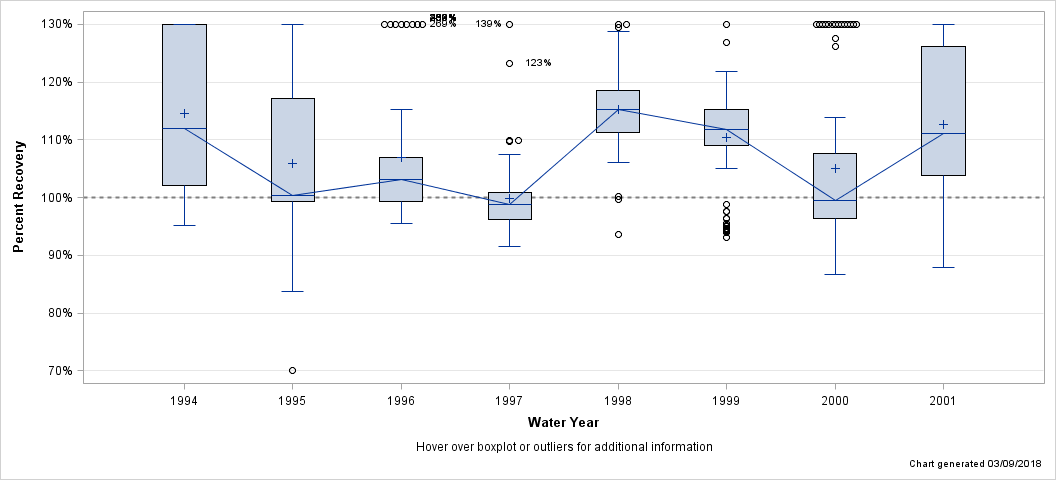
| Percent Recovery Statistics for Zinc, FIL, ICP-MS |
| Analyte | Parm-meth Code | Water Year | # of Samples |
25th Pctl | 50th Pctl (Median) |
75th Pctl |
|---|---|---|---|---|---|---|
| Zinc, FIL, ICP-MS | 01090PLM43 | 1994 | 32 | 102.1% | 112.0% | 209.4% |
| 1995 | 47 | 99.4% | 100.4% | 117.2% | ||
| 1996 | 46 | 99.4% | 103.2% | 107.0% | ||
| 1997 | 48 | 96.2% | 98.7% | 100.8% | ||
| 1998 | 96 | 111.3% | 115.2% | 118.5% | ||
| 1999 | 96 | 109.0% | 111.8% | 115.2% | ||
| 2000 | 72 | 96.3% | 99.5% | 107.7% | ||
| 2001 | 71 | 103.9% | 111.2% | 126.1% |
| Hover over boxplot or outliers for additional information |
| Chart generated 03/09/2018 |
| - Zinc, FIL, ICP-OES - |
| Lab: NWQL, PCode: 01090, MCode: PLA11 |
| Login Dates: 10/14/86 through 09/27/01 |
| Open Data Set |
| Boxplot Description |
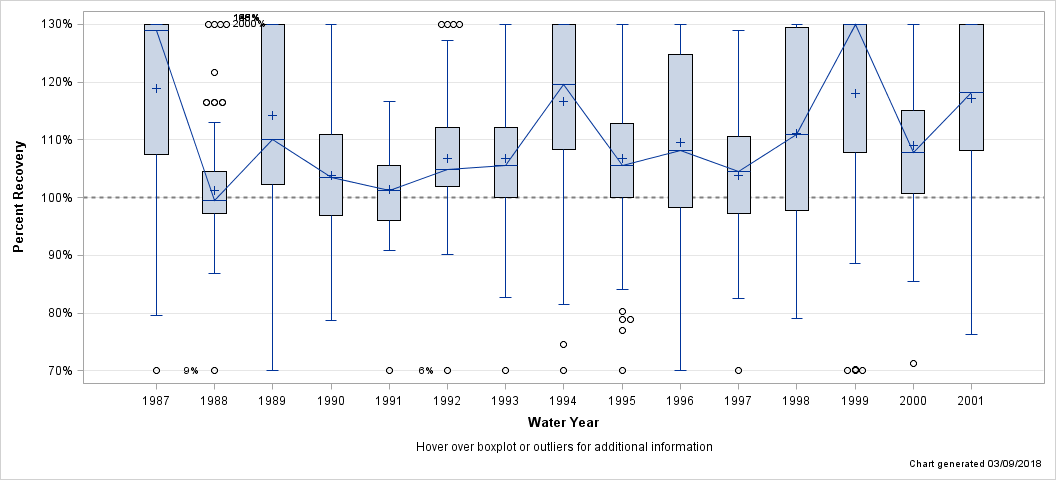
| Percent Recovery Statistics for Zinc, FIL, ICP-OES |
| Analyte | Parm-meth Code | Water Year | # of Samples |
25th Pctl | 50th Pctl (Median) |
75th Pctl |
|---|---|---|---|---|---|---|
| Zinc, FIL, ICP-OES | 01090PLA11 | 1987 | 162 | 107.5% | 129.0% | 161.3% |
| 1988 | 186 | 97.2% | 99.5% | 104.6% | ||
| 1989 | 123 | 102.2% | 110.1% | 146.1% | ||
| 1990 | 130 | 97.0% | 103.4% | 110.9% | ||
| 1991 | 191 | 96.0% | 101.3% | 105.5% | ||
| 1992 | 165 | 102.0% | 104.8% | 112.1% | ||
| 1993 | 178 | 100.0% | 105.6% | 112.1% | ||
| 1994 | 156 | 108.3% | 119.6% | 135.0% | ||
| 1995 | 135 | 100.0% | 105.6% | 112.9% | ||
| 1996 | 108 | 98.3% | 108.1% | 124.8% | ||
| 1997 | 117 | 97.2% | 104.6% | 110.5% | ||
| 1998 | 52 | 97.8% | 111.0% | 131.3% | ||
| 1999 | 63 | 107.8% | 138.5% | 166.0% | ||
| 2000 | 49 | 100.7% | 107.8% | 115.2% | ||
| 2001 | 59 | 108.2% | 118.1% | 131.8% |
| Hover over boxplot or outliers for additional information |
| Chart generated 03/09/2018 |
| - Zinc, UNF, AA - |
| Lab: NWQL, PCode: 01092, MCode: AA071 |
| Login Dates: 10/14/86 through 03/12/99 |
| Open Data Set |
| Boxplot Description |
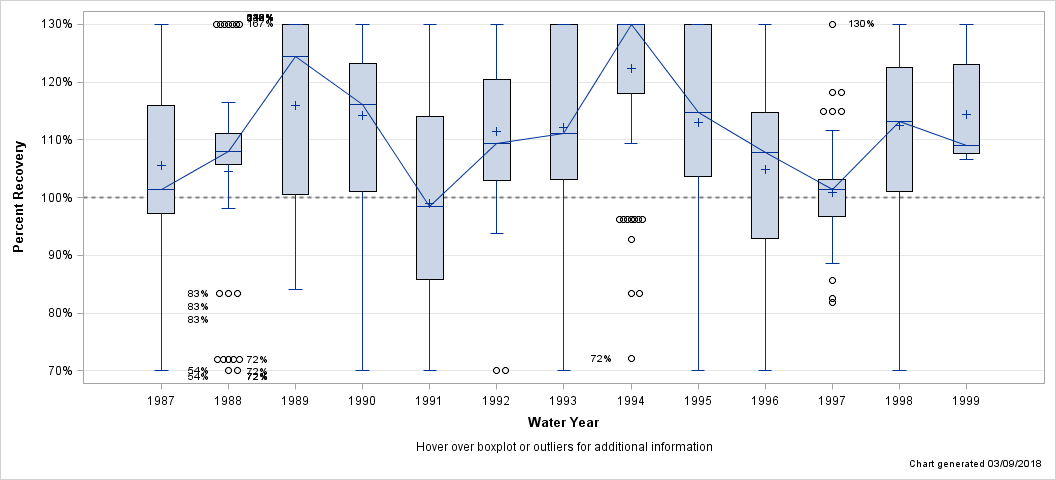
| Percent Recovery Statistics for Zinc, UNF, AA |
| Analyte | Parm-meth Code | Water Year | # of Samples |
25th Pctl | 50th Pctl (Median) |
75th Pctl |
|---|---|---|---|---|---|---|
| Zinc, UNF, AA | 01092AA071 | 1987 | 27 | 97.2% | 101.4% | 115.9% |
| 1988 | 46 | 105.8% | 107.9% | 111.1% | ||
| 1989 | 42 | 100.5% | 124.5% | 168.1% | ||
| 1990 | 65 | 101.0% | 116.1% | 123.2% | ||
| 1991 | 73 | 85.9% | 98.4% | 114.0% | ||
| 1992 | 82 | 102.9% | 109.3% | 120.5% | ||
| 1993 | 80 | 103.1% | 111.1% | 144.2% | ||
| 1994 | 120 | 118.1% | 163.9% | 248.8% | ||
| 1995 | 120 | 103.6% | 114.7% | 134.4% | ||
| 1996 | 102 | 92.9% | 107.8% | 114.7% | ||
| 1997 | 93 | 96.7% | 101.4% | 103.2% | ||
| 1998 | 72 | 101.0% | 113.1% | 122.5% | ||
| 1999 | 15 | 107.7% | 109.1% | 123.1% |
| Hover over boxplot or outliers for additional information |
| Chart generated 03/09/2018 |
| - Zinc, UNF, ICP-OES - |
| Lab: NWQL, PCode: 01092, MCode: PLA15 |
| Login Dates: 04/05/99 through 09/28/01 |
| Open Data Set |
| Boxplot Description |
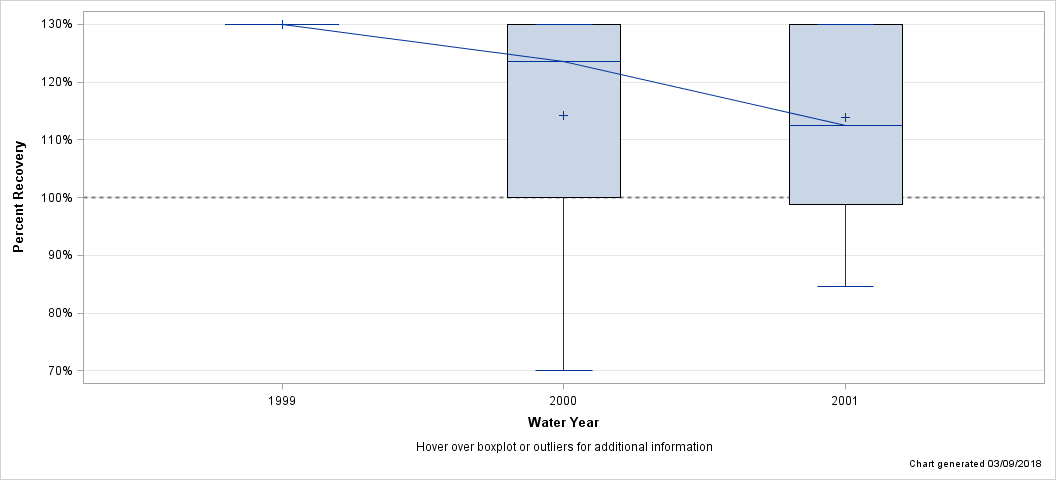
| Percent Recovery Statistics for Zinc, UNF, ICP-OES |
| Analyte | Parm-meth Code | Water Year | # of Samples |
25th Pctl | 50th Pctl (Median) |
75th Pctl |
|---|---|---|---|---|---|---|
| Zinc, UNF, ICP-OES | 01092PLA15 | 1999 | 5 | 141.6% | 211.0% | 238.8% |
| 2000 | 50 | 99.9% | 123.7% | 162.0% | ||
| 2001 | 49 | 98.9% | 112.5% | 138.8% |
| Hover over boxplot or outliers for additional information |
| Chart generated 03/09/2018 |